**This is an old revision of the document!**
PlayGround
Test stuff here.
Introduction
In recent years, technology has transformed ordinary household items into connected devices, a trend often referred to as the “smartification” of everyday objects. From thermostats, watches and lighting systems have become intelligent, these devices now collect data, analyse behavior, and make daily routines more efficient and personalized.
Our product, TRAQUA, is a smart water bottle which is a great example of this evolution. Beyond simply holding water, it actively analyzes the purity of the liquid and monitors the user’s hydration needs. By connecting to a companion app, the bottle provides real-time insights, reminders, and personalized recommendations to help users maintain optimal health. This integration of sensing technology, data collection, and mobile connectivity demonstrates how even a simple object like a water bottle can be transformed into a smart, health-focused device. With TRAQUA, users also gain assurance about the quality of their water. To achieve this, a filter is integrated, minerals are monitored via a TDS sensor, and both the filter and the water are purified. As a result, customers can be confident that their tap water is clean and enjoy greater flexibility.
The following report describes the development of the TRAQUA project.
Presentation
The TRAQUA team (Figure 1) consists of six students from diverse nationalities and academic backgrounds who have come together at ISEP to take part in the European Project Semester (Table 1).

| Name | Home country | Field of Study |
|---|---|---|
| Bernardo Alves | Portugal - Luxembourg | Information Technology |
| Maria Wlodarczyk | Poland | Business, Society & Technology |
| Guillem Vázquez Rolduà | Spain | Industrial Design & Product Development |
| Inès Margand | France | Packaging Engineering |
| Maximilian Salmi | Finland | Electrical & Automation Engineering |
| Rieke Platthaus | Germany | Environmental & Civil Engineering |
Motivation
As a team, we have chosen the European Project Semester because we believe this experience will enrich us both professionally and personally. Working in a multidisciplinary, international team provides us with the unique opportunity to collaborate with people from diverse cultures and academic backgrounds. A central goal for us is to forge international connections and to discover Europe and our respective home countries from entirely new perspectives. We deeply value interdisciplinarity at all levels, both geographically, through cultural exchange, and academically, by synergizing our various fields of expertise. This framework allows us to enhance our creativity and problem-solving skills while preparing ourselves for a global professional work environment.
The idea of developing a smart reusable bottle came about very quickly. It was important to us to create an item that would improve the everyday life of the user. The motivation came from health improvements as well as sustainability reasons. These are explained below.
The development of a smart, reusable water bottle directly addresses environmental concerns. By offering a durable, long-lasting alternative to single-use plastic bottles, the system encourages more sustainable behavior and reduces plastic waste. Users can rely on one high-quality product instead of repeatedly purchasing disposable bottles, contributing to a more eco-friendly lifestyle. Nevertheless, reusable bottles are already part of most people’s everyday lives. Using them saves not only plastic resources but also money, as users do not have to buy plastic bottles.
However, this raises the problem that often not enough attention is paid to the hygiene of the bottle and the quality of the water. At the same time, it is easy to lose track of how much you are drinking. A smart bottle addresses both issues.
The bottle focuses on supporting healthy hydration. By using microcontrollers, it can track the volume of water consumed and monitor the fill level in real time. This helps users ensure they drink enough throughout the day, an especially important factor for individuals with health conditions that require consistent fluid intake.
By linking microcontrollers to obtain values such as minerals, and organic residues, users can be sure of the quality of the water and drink without worry. The bottle therefore supports healthy hydration, while the quality assurance feature can remind users to clean the bottle regularly. People who are particularly dependent on regular water intake, such as those with diabetes or kidney disease, can track the amount they drink. At the same time, the smart bottle can be a helpful device for anyone who wants to stay hydrated and maintain an overview of their intake. To further strengthen motivation, the system can be connected to a user-friendly app that uses gamification elements to make hydration tracking intuitive. This playful approach helps users build lasting habits without effort.
Overall, the project aims to combine sustainability, health awareness, and smart technology into a practical everyday solution that users are motivated to adopt and continue using.
Objective
The purpose of this product is to measure the purity of tap water, as well as encouraging customers to keep themselves hydrated throughout the day. Our main objective is to adapt a smart bottle into the everyday life of people who are concerned about the cleanliness of the tap water at their home, or in a foreign environment. Our intended audience are people who care about their health and are willing to download an app, to track their daily water intake.
Objectives:
- Develop a smart water bottle that monitors tap water quality fast and reliably.
- Measure key water parameters Total Dissolved Solids (TDS), temperature, potential impurities etc.).
- Provide real-time feedback to ensure safe water consumption.
- Use UV-C light to clean water and bottle.
- Track daily water intake through a connected mobile application.
- Deliver personalized hydration goals based on user data.
- Use gamification features (challenges, streaks, rewards) to encourage consistent hydration habits.
- Design the product to be portable, simple, reliable, and easy to integrate into everyday life.
- Target health-conscious individuals concerned about water purity at home or in unfamiliar environments.
- Combine safety, technology, and behavioral motivation into one practical and user-friendly solution.
Problem
Staying hydrated is one of those things we all know we should do, but rarely manage to do well. It is not just about forgetting to drink enough water, it is about the reality that we have no idea if the water we’re carrying is actually good for us.
Right now, the market is split, and honestly, both sides are falling short:
- The Common Bottle: Most reusable bottles on the market are just fancy cups. They do not track your habits, and they definitely do not tell you if the water quality is compromised by poor mineral levels or contaminants. Many bottles become dirty very quikly.
- The Basic Trackers: There are bottles that log your daily intake, sure, but they are essentially one-trick ponies. They ignore the chemistry of the water entirely. They will tell you how much you drank, but not what you drank. There are bottles that clean itself and the water, but they do not mesure anything else.
- The Overpriced/Clunky Tech: Then you have the high-end solutions. Usually they are very expensive and focuse only on one topic. They promise the world but usually come with a price tag that feels more like an investment than a purchase, or they are saddled with buggy, unintuitive apps that make tracking feel like a part-time job.
The current smart bottle market is fragmented, and existing solutions fail to address the problem in a comprehensive and reliable way:
- Conventional Reusable Bottles: Most reusable bottles function as simple containers without any intelligent features. They do not provide feedback on hydration behavior, water quality, or hygiene. As a result, users receive no guidance, while bottles can quickly become contaminated due to insufficient cleaning, leading to unnoticed hygiene risks. Many reusable ottle have a hygiene problem, because they are not cleaned proberly.
- Basic Tracking Solutions: some smart bottles focus on hydration tracking by measuring water intake and providing reminders. However, these solutions are limited in scope. They only quantify how much water is consumed but completely ignore water quality, mineral content, and contamination risks. Similarly, bottles with UV-C cleaning address hygiene but do not provide any data or insights beyond that single function.
- High-End but Limited Systems: More advanced products on the market are often expensive and tend to focus on isolated features rather than offering an integrated solution. In addition, they may rely on complex or unintuitive apps, which can reduce usability and discourage long-term engagement. The high price point also limits accessibility for a broader user base.
Overall, existing products address individual aspects such as tracking, cleaning, or design, but fail to combine hydration monitoring, hygiene, and water quality analysis into one coherent and user-friendly system.
Requirements
The following requirements have been established to guide through the development of this project. Requirements are uniquely identified for traceability through the project lifecycle.
General Requirements
- Budget Constraints: The team has a total budget of 100 €. That budget should not be exceeded. Priority is given to hardware pieces to have more precise data.
- Adopt the International System of Units (SI) <color #ed1c24>[1].
- All electronic components shall comply with Directive 2011/65/EU (RoHS), restricting hazardous substances [2].
- Wireless communication modules shall comply with Directive 2014/53/EU (RED) [3].
- Other aspects like the EMDC and LVD must also be complied.
App Requirements
- Easy to use
- User-friendly interface
- Core actions shall be reachable within two clicks
- Developed using react
- Error prevention
- The application shall display the user’s cumulative water intake for the current day in millilitres (ml)
- Track water intake, minerals in water and other useful data for the user
- Personal data collection and processing shall comply with Regulation (EU) 2016/679 GDPR [4]
Sustainability requirements
- The material used for the bottle should be environmentally friendly
- Use energy-saving technologies during the production process
- Keep the carbon footprint as minimal as possible
User Requirements
- As a user I want to track my total water intake
- The usage must be safe
- As a user I want to know if the tap water I poured in my bottle is safe to drink or not
- As a user I want to have a bottle that both easy to cary and also has a nice design
Key Requirements
- Arduino chip
- Mineral reading sensors
Tests
Before TRAQUA can be successfully deployed, it is essential to ensure that the entire smart water bottle system operates reliably and safely. This requires structured testing at every stage—from the physical sensors up to the mobile application —to catch bugs early and guarantee a seamless user experience.
Our testing focus centers on these key areas:
- Water-Quality Classification & States: The core of TRAQUA is its ability to accurately classify water safety into states (Safe, Warning, Unsafe, or Unknown) based on pH, TDS, and temperature readings. We test this full chain to ensure the physical bottle and the app always display the correct safety verdict.
- Fail-Safe Interlocks (UVC Light): For user safety, the UVC disinfection light must never turn on unless the bottle is fully closed. We strictly test the magnetic reed switch connection to ensure the light safely deactivates if the interlock isn't met.
- Bluetooth (BLE) Connection Reliability: We need to verify that the ESP32 firmware and the React Native app communicate without a hitch. This includes testing how the app handles poor signal, packet loss, and automatic reconnection if the connection drops.
- Handling Bad Sensor Data: If a sensor sends corrupted data or disconnects, the system must handle it gracefully. We test “Unknown” states using simulated poor readings to make sure the app fails safe rather than showing outdated, dangerous data.
- Hydration Tracking Accuracy: To ensure consumer features work perfectly, we test the bottle's ability to detect actual drinking events, update daily goal progress, and accurately trigger the 12-hour idle reset logic.
- Component & Interface Performance: Using physical hardware (like the ESP32, OLED screen, and status LEDs) alongside frontend validation, we test to ensure that on-device alerts match the application's interface feedback instantly.
Report Structure
Chapter 1 Introduction 2 Background and Related Work 3 Project Management 4 Marketing Plan 5 Eco-efficiency Measures for Sustainability 6 Ethical and Deontological Concerns 7 Project Development 8 Conclusion 9 Acknowledgements
Background and Related Work
Introduction
The foundation of this project lies in investigating modern health and hygiene aspects within the field of hydration. A central issue with the use of reusable bottles is often inadequate cleaning, which increases the risk of contamination from bacteria, yeast, or mold. Parallel to this, many individuals neglect their daily water intake due to forgetfulness or a lack of awareness, leading to significant health risks associated with dehydration.
This chapter provides the necessary concepts and background information to address these challenges technologically. We focus on this target group: young, health-conscious and tech-savvy individuals who view a user-friendly app as an enrichment of their daily lives and who prioritize not only clean water and bottles but also a sufficient supply of minerals and consistent hydration. Especially travelers who are often unsure about the local water quality abroad can benefit from a smart bottle.
Before presenting our own solution, we will first analyze concepts, existing products and projects on the market. Finally, a detailed comparative table will be provided, evaluating current market leaders alongside the specific sensors and features relevant to our project.
Concepts
The IoT and Digital Health Framework
The smartification of everyday objects is a key aspect of the Internet of Things (IoT) and digital health technologies [5]. Water bottles represent an interesting application area because hydration plays an essential role in human health and can be influenced through behavioral interventions. Smart water bottles typically combine sensors, microcontrollers and mobile applications to monitor water consumption, motivate users to drink regularly, and potentially analyze certain aspects of water quality [6].
Physiological Hydration and Health Dynamics
The primary concept behind smart hydration is the body’s requirement for an adequate water supply to ensure waste excretion via the kidneys, correct electrolyte balance, and efficient heat dissipation through sweat [7]. Beyond the total volume, the frequency of intake is crucial; regular hydration promotes brain function, improves physical performance, and positively impacts chronic diseases [8]. Since it is difficult for individuals to subjectively assess their daily intake, technology serves as an objective tool for self-monitoring to prevent dehydration, which is a common risk for the elderly, the sick, and highly active individuals. Nevertheless, adequate hydration affects everyone [9].
Hygiene, Biofilms, and Contamination Risks
While reusable bottles are generally more sustainable and economical, they also require regular cleaning. Observations of user behavior suggest that many consumers frequently refill their bottles without cleaning them sufficiently. A major theoretical challenge is the hygiene gap, because these bottles often harbor heterotrophic plate counts (HPC), which include bacteria, yeast, and mold [10]. The Colony Forming Units per milliliter (CFU/ml) is a measure for the number of living, reproducible bacteria or fungi in a liquid sample [11]. In the EU, the safety limit of 100 CFU/mL is frequently exceeded because users often refill bottles without sufficient cleaning [12]. Microorganisms form biofilms on internal surfaces, especially when nutrients are present and disinfectants are absent, potentially leading to foodborne illnesses in vulnerable groups [13].
Mineralization and Nutritional Value
Another important components of drinking water are minerals. Minerals such as calcium and magnesium contribute essential bodily functions support bone health, muscle function, and nerve signaling. They also help maintain the body’s electrolyte balance and proper hydration. Although most minerals are obtained from food, drinking water can provide a valuable additional source. A study examined the relationship between drinking water total dissolved solids (TDS) and serum mineral levels in adults. Participants consuming higher-TDS water showed higher levels of calcium and magnesium in their blood compared to those drinking low-TDS water. The results suggest that mineral content in drinking water can contribute to overall mineral intake and electrolyte balance. The findings demonstrate that mineral water can play an important role in supporting dietary mineral balance [14].
Recommended water requirement
The determination of an individual’s optimal water requirement is a complex concept that transcends the standardized “eight-glass” rule. According to the National Academies of Sciences, Engineering, and Medicine, the general adequate intake (AI) for healthy adults in temperate climates is approximately 3.7 l for men and 2.7 l for women per day. The adequate intakes represent an amount that should meet the needs of almost everyone in a specific life-stage group who is healthy, consumes an average diet, and performs moderate levels of physical activity. This value is a guideline for adults over the age of 19. A distinction is also made between pregnant and breastfeeding women. For infants, children, and adolescents, the value varies depending on age. In Europe, the recommended water intake is lower than in the US, at 2.5 l for men and 2.0 l for women. However, these figures represent total fluid intake, including moisture from food, which typically accounts for 20 % of the daily total [15].
In addition to age and gender, daily water requirements depend on many other factors, such as physical and cognitive activity and diet, for example, whether a lot of protein is consumed. Of course, medical factors such as body mass index, blood pressure, blood volume, and hormone status also play a role. Another influencing factor is environmental conditions, as climatic conditions are decisive for the water consumption required to regulate the body's condition. Despite numerous efforts to determine the daily water requirements of children, men, women, and older adults, no empirical research provides clear answers, and there is no consensus. The dynamic complexity of the water regulation network and interindividual differences are the main reasons why no general consensus on daily water requirements has been reached to date. It is therefore not generally possible to make fundamental statements. By integrating these variables into a smart system, hydration tracking can move from a static goal to a personalized health intervention [16].
Sensors and components
Total Dissolved Solids Sensor
A TDS sensor measures the amount of dissolved substances in water by detecting its electrical conductivity. When minerals such as salts, calcium, or magnesium dissolve in water, they release charged ions that allow electricity to pass through the liquid. The sensor measures this conductivity and converts it into an estimated concentration of dissolved solids, usually expressed in mg/l. The advantage of this sensor is that it is inexpensive, compact, and able to provide quick measurements that indicate the general mineral content of water. However, it cannot identify which specific substances are present, and it also cannot detect biological contamination such as bacteria or viruses. The temperature is required to evaluate the TDS data. Therefore, an additional temperature sensor is necessary.
Temperature Sensor
A temperature sensor measures the temperature of water or the surrounding environment. In many water monitoring systems, temperature plays an important role because physical properties such as electrical conductivity change depending on temperature. For example, the conductivity of water increases by about two percent for every °C increase. By measuring temperature, the system can correct other sensor readings and improve their accuracy. The main advantage of temperature sensors is that they are highly precise, energy-efficient, and easy to integrate into electronic systems. Their limitation is that they do not provide direct information about water quality and mainly serve as supporting sensors for other measurements.
UV-C LED Module
An Ultraviolet-C (UV-C) light-emitting diode (LED) module uses ultraviolet light with wavelengths typically between 250 and 280 nm to disinfect water. This type of light damages the DNA of microorganisms such as bacteria and viruses, preventing them from reproducing and effectively inactivating them. UV-C sterilization is widely used in water treatment because it works quickly and does not require chemicals. Its advantages include fast disinfection and relatively low maintenance once installed. However, UV-C technology requires electrical power and does not remove dissolved chemicals or particles from the water, meaning it is often combined with other filtration methods.
pH Sensor
A pH sensor measures the acidity or alkalinity of water by detecting the concentration of hydrogen ions. Organic substances can sometimes influence the pH indirectly when they are broken down by bacteria, which may produce organic acids and slightly lower the pH. However, this process is slow and indirect, meaning the sensor does not detect organic compounds themselves but only changes in acidity.
The main limitation is that many other factors, such as dissolved carbon dioxide, minerals, or chemicals, can also affect the pH value. This makes the results non-specific and often difficult to interpret. In addition, pH sensors require regular calibration to maintain accuracy.
Overall, pH measurements provide only rough indications of possible organic activity in water rather than clear information about contamination. Since microorganisms can be directly inactivated through UV-C disinfection, pH monitoring often adds limited additional value in such systems.
Turbidity Sensor
A turbidity sensor measures the cloudiness of water by detecting how much light is scattered by particles suspended in the liquid. An LED shines light into the water while a photodiode measures how much of this light passes through or is scattered. If many particles such as sediments or microorganisms are present, more light is scattered and less reaches the sensor, indicating higher turbidity.
However, turbidity sensors only respond to physical particles and cannot detect dissolved substances such as minerals or chemicals. Their measurements can also be affected by air bubbles, biofilm, or deposits on the sensor surface, which may lead to inaccurate readings and require regular cleaning. While turbidity sensors are relatively cheap and easy to integrate, they provide only limited information about overall water quality. Turbidity sensors are therefore used in heavily contaminated water. Also because they primarily measure flowing water this is the reason why they are not suitable for the usage in a water bottle.
Pressure Sensor
A pressure sensor detects the force exerted by a fluid on a surface. In water-related applications, this measurement can be used to estimate the height of a water column and therefore determine the liquid level inside a container. Since pressure increases proportionally with depth, the sensor can calculate the amount of water present. Pressure sensors are advantageous because they offer high precision and reliable measurements even in small spaces. Many pressure sensors include temperature sensors.
Gravity Sensor
A tri-axial accelerometer measures acceleration and orientation relative to gravity. By detecting changes in motion and tilt, the sensor can determine whether an object is upright, tilted, or moving. This type of sensor is commonly used in smartphones, wearable devices, and other portable electronics. The main advantages of accelerometers are their extremely small size, low energy consumption, and versatility in detecting movement and position. Their limitation is that they do not measure environmental conditions such as water quality, and the collected data often requires additional software processing to interpret correctly.
Activated Carbon Filter
Activated carbon filters work through a process called adsorption, where contaminants attach to the surface of the carbon material. The carbon is processed to create a highly porous structure with an enormous surface area, which allows it to trap chemicals such as chlorine, organic compounds, and substances that cause unpleasant taste or odor. One major advantage of activated carbon is that it is inexpensive, widely available, and does not require electricity. However, it cannot effectively remove microorganisms like bacteria or viruses, and its performance decreases over time as the pores become saturated.
Carbon Block Filter
A carbon block filter is a more compact and dense form of activated carbon filtration. The carbon is compressed into a solid block with very small pores, forcing water to pass through the material slowly. This increases the contact between the water and the carbon surface, improving the removal of chemicals, chlorine, and some heavy metals. The advantage of carbon block filters is that they generally provide better filtration performance than loose carbon particles and can also improve the taste and smell of water. However, the filter must be replaced periodically, and it still cannot reliably remove microorganisms.
Material
Some of the caps on the market are be made of polypropylene (PP). This material is chosen for its excellent resistance to mechanical fatigue, meaning it can withstand repeated opening and closing without degrading. Polypropylene is also lightweight, waterproof, and chemically resistant, making it ideal for a bottle cap that must ensure a tight seal over long-term use.
Polished aluminum has proven to be a reliable choice for the body of the bottle, which contains the water. Aluminum is selected for several key reasons. First, when polished, aluminium becomes highly reflective. By reflecting the UV-C light throughout the interior surface, the aluminum increases the exposure of the water and the bottle walls to the UV-C radiation, which improves the disinfection and cleaning efficiency of the system. Additionally, the reflective aluminum can help reduce heat loss or gain by reflecting thermal radiation. Second, it is lightweight, durable and resistant to corrosion, making it suitable for everyday use.
The part of the bottle, which contains the electronic components (such as the battery, sensors, and LED), is often be made of plastic, like polycarbonate. This material is essential because it provides electrical insulation, preventing any contact between the conductive aluminum body and the electronic systems. It also offers waterproof protection, ensuring that the electronics remain safe and functional even in a humid environment. The plastic structure also helps absorb shocks and protect sensitive components.
In conclusion, the combination of polypropylene for durability, polished aluminum for thermal and reflective performance, and plastic for electrical insulation and protection ensures that the smart water bottle will be safe, efficient, and suitable for everyday use.
Products
Since various smart water bottles already exist on the market, analyzing these products can provide valuable insights for the development of a new design. By examining existing solutions, it is possible to identify useful technologies, components, and design approaches that may be relevant for the proposed system. This chapter therefore reviews several existing products and highlights their most important features, with a particular focus on the differences in their design concepts and functionalities. A summary table at the end of the chapter provides a direct comparison of the analyzed products.
The LARQ Bottle PureVis focuses primarily on water hygiene rather than hydration tracking. Its key feature is an integrated UV-C LED system, which disinfects both the water and the inner surface of the bottle. The UV-C light can be activated manually or automatically at regular intervals to eliminate up to 99.99 % of bacteria and viruses inside the bottle. The desinfection process takes 10 seconds. Some versions also include optional hydration tracking via a smartphone app and may be equipped with a replaceable filter to remove contaminants such as chlorine or heavy metals. The bottle is typically available in 500 ml and 740 ml versions, weighing around 380 g and 500 g. Thanks to its double-walled stainless-steel insulation, it can keep drinks cold for up to 24 hours and hot for about 12 hours. With a price range of about 90 € to 120 €, the LARQ bottle is relatively expensive, but its main advantage lies in the self-cleaning function and improved water hygiene, making it particularly suitable for travel and outdoor use [17].
Aqua Vault is a smart reusable water bottle designed to provide safe and clean drinking water wherever you are. The bottle features a UV-C sterilization system integrated into the lid, which effectively eliminates bacteria, viruses, and organic residues both in the water and inside the bottle. A built-in screen on the lid allows users to easily start and monitor the cleaning cycle. With a 3-minute sterilization process, Aqua Vault quickly disinfects the water and the interior of the bottle, ensuring a reliable and hygienic drinking experience [18].
Compared to the LARQ bottle, which also uses UV-C technology for water purification, Aqua Vault focuses on greater user interaction and transparency through its integrated display, allowing users to clearly see the cleaning status and cycle progress. While LARQ emphasizes automated purification, Aqua Vault combines UV-C sterilization, user feedback through the screen, and a simple 3-minute cleaning cycle to give users more control and confidence in the quality of their water.
In contrast, the HidrateSpark Pro Tumbler focuses on hydration monitoring and behavioral motivation. The bottle contains a sensor in the base that measures the water level, allowing it to automatically track how much water the user drinks. The data is transmitted via Bluetooth to a smartphone app, where users can monitor their hydration level, set personal drinking goals, and view statistics or achievements. A distinctive feature of this bottle is its LED light system, which lights up in different colors to remind users to drink throughout the day. The bottle can also integrate with health platforms such as Apple Health and it supports Apple Find My for locating the bottle. The bottle typically has a capacity of about 620 ml, weighs around 400 g to 500 g, and costs approximately 70 € to 90 €. Its main advantage is the automatic tracking of drinking behavior, although it requires charging and may occasionally experience Bluetooth connectivity issues [19].
The Ozmo Active Smart Bottle extends the concept of hydration tracking by integrating fitness and lifestyle data. Similar to the HidrateSpark bottle, it uses sensors to measure fluid intake and sends the data to a smartphone app via Bluetooth. However, a key difference is that the Ozmo system can distinguish between different beverages, such as water and coffee, allowing users to monitor their total fluid consumption more comprehensively. The system also provides hydration reminders and integrates fitness and health platforms, linking hydration with physical activity data. The bottle has a capacity of around 600 ml, weighs approximately 400 g to 450 g, and costs around 60 € to 80 €. While the ability to track multiple beverage types provides a broader overview of fluid intake, the system can be more complex to use and mainly targets users interested in detailed health and fitness monitoring [20].
The equa Smart Water Bottle, on the other hand, focuses on simplicity and user motivation. Its main feature is a light signal integrated into the bottle, which illuminates to remind the user to drink regularly. The bottle connects via Bluetooth to the EQUA Hydration App, where the user’s daily water intake is tracked. The app also calculates a recommended daily hydration level based on personal parameters, such as body characteristics and activity level. In contrast to more sensor-focused systems, the Equa bottle mainly encourages hydration through reminders and app-based tracking rather than precise intake measurement. The bottle is made of double-walled, vacuum-insulated stainless steel, has a capacity of 680 ml, and weighs around 350 g to 400 g. Its typical price is 70 € to 90 €. The main advantage of the Equa bottle is its simple and intuitive reminder system, although, like other smart bottles, it requires charging and is more expensive than conventional bottles [21].
Overall, these products demonstrate different approaches to smart hydration systems. While the LARQ bottle emphasizes water purification, the HidrateSpark focuses on precise hydration tracking, the Ozmo system integrates hydration with broader health data, and the Equa bottle prioritizes simple reminders and user motivation. These differences highlight the range of possible functionalities and design strategies that can be considered when developing a new smart water bottle system. It turns out that all these areas, disinfection, water quality control, quantity tracking, and motivation and overview via a connected app, are already covered by individual bottles. However, there is currently no water bottle that combines all these aspects.
Projects
Clinical Trials on Behavioral Intervention
Various projects have used clinical settings to test the efficacy of smart hardware. A randomized trial showed that patients using smart bottles with integrated hydration reminders achieved a much higher daily fluid intake compared to a control group [22]. Similarly, research involving college students demonstrated that digital feedback loops and historical data provided via an app significantly increase a user's awareness of their hydration patterns [23].
Technical Execution: Acoustic and Visual Feedback
Specific engineering projects have explored different ways to alert users. While most rely on smartphone notifications, some projects have successfully implemented reminders, such as acoustic signals or glowing LED bases, to prompt hydration without requiring the user to check a screen [24].
The UV-C Sterilization Project
The study [25] found that more than 20 % of reusable bottles had bacterial counts that exceeded the limit. Organic substances are referred to as heterotrophic plate count (HPC) and include mold, bacteria, and yeast. Different countries have different limit values for HPC in tap water [26]. In the EU, the limit is 100 CFU/ml which is exceeded in many water bottles even though the tap water used to fill them is clean. The design of the bottle, how it is used, the material, whether it is used for water or other beverages, the age of the bottle, and how it is cleaned are all important factors. Improperly cleaned bottles may therefore present a contamination risk and potentially contribute to foodborne illness, especially for vulnerable groups such as children, older adults, or immunocompromised individuals. Microorganisms commonly grow in water and on surfaces in contact with water in the form of biofilms, particularly when nutrients are available and no disinfectant is present [27].
A major project-based advancement in smart bottles is the implementation of UV-C LED technology for internal sterilization. This addresses the hygiene problem of bacteria, yeast and mold without requiring physical filters or chemicals. It turns a standard container into a self-cleaning medical-grade device. There is a new approach in which the UV-C light spectrum is used to disinfect both the water and the bottle itself. The spectrum range between 250 nm and 280 nm is crucial. Only this can ensure that the DNA and mRNA of the microorganisms in the water are destroyed and the organic matter is killed. It is also important that the inner surface of the bottle is reflective and that all materials exposed to the light are UV-C resistant [28]. This concept will be introduced in connection with the products of the company LARQ and ensures that organic contaminants are eliminated.
Environmental Impact and Sustainability Projects
The development of smart reusable bottles is also a response to the global plastic crisis. Normal plastic water bottles have a significant environmental impact throughout their entire life cycle. Studies have shown that bottled water can have an environmental footprint up to 3500 times greater than tap water, mainly due to plastic production, packaging, transportation, and waste management. The manufacturing of single-use plastic bottles requires large amounts of energy and fossil resources, which contributes to greenhouse gas emissions [29]. In addition, many plastic bottles are not properly recycled and end up in landfills or in natural environments such as rivers and oceans. This can lead to long-term pollution, the formation of microplastics, and harm to wildlife that may ingest or become trapped in plastic waste. These consequences highlight the environmental importance of reducing single-use plastic bottles and promoting reusable and more sustainable alternatives. The use of reusable bottles is one opportunity to reduce the consumption of plastic bottles and therefore offer a way to face the environmental impact [30].
Advanced Sensing and Future Integration
Recent research projects are exploring the integration of advanced sensors into portable bottles to detect specific contaminants and monitor real-time mineral content. While no commercial bottle currently measures TDS or minerals directly, studies have proven the health benefits of such data [31]. Current project goals focus on overcoming technical hurdles like sensor miniaturization and power consumption to make these features a reality in everyday life.
Comparative Analysis
Table 2 compares the different products.
| Photo | Product | Price (€) | Volume (ml) | Weight (g) | Material | Feature | App | Design |
|---|---|---|---|---|---|---|---|---|
 | LARQ Bottle PureVis | 90–120 | 500, 740 | 380, 500 | Stainless steel, UV-C LED for disinfection, optional filter | UV self-cleaning (10 s), hydration tracking | Yes | Minimalist cylindrical design focused on hygiene, large lid |
 | Aqua Vault | 90–130 | 500, 750 | 420–520 | Stainless steel body, UV-C LED in lid, integrated display | UV-C sterilization cycle (3 min), screen | No | Modern smart bottle design with integrated screen in large lid |
 | HidrateSpark Pro Tumbler | 70–90 | 620 | 400–500 | Stainless steel or Tritan plastic, sensor in bottle base | Tracks water intake, LED drink reminders, Bluetooth | Yes | Classic bottle shape with LED ring in the base |
 | Ozmo Active Smart Bottle | 60–80 | 600 | 400–450 | Plastic/stainless steel with integrated sensors | Tracks water and other beverages, hydration reminders | Yes | Technical design with integrated sensor system |
 | Equa Smart Bottle | 70–90 | 680 | 350–400 | Stainless steel, LED reminder module | Hydration reminders and intake tracking | Yes | Minimalist insulated bottle with light indicator |
Table 3 compares and discusses the different components.
| Component | Size (mm) | Price (€) | Power Consumption (mW) | Weight (g) |
|---|---|---|---|---|
| TDS Sensor (SEN0244) | 42 x 32 (cable ~800) | 23 | 10–30 | ~32 |
| Pressure Sensor (FSR406) | 43.7 x 43.7 | 13 | 2–3 | ~3 |
| UV-C LED Module | 30 x 30 | ~30 | 0–5 (standby), 1000 (cleaning) | ~3 |
| Accelerometer (LIS3DHTR) | 20 x 15 x 3 | ~10 | 0,165 | 2 |
| Temperature Sensor (KY-015 DHT) | 32 x 14 $\times$ 7 | 11 | 7 | 8 |
| Piece of activated carbon | 50 x 30 | 12 | 0 | 5 (dry), 10 (wet) |
| Microcontroller (ESP32 DevKit V1) | 56 x 28 x 13 | 13 | 792 | 20 |
| SSD1306 OLED Display (0.96“) | 25 x 26 | 4 | 82,5 | 4 |
Summary
The analysis of existing concepts, projects and smart water bottles shows that many products address individual aspects of hydration and water quality. Some focus on hydration tracking and behavioral motivation through smartphone apps, while others integrate UV-C technology for disinfection or include filtration systems. However, there is currently no product on the market that combines UV-C disinfection, water filtration, volume tracking, mineral content measurement, and a user-friendly app with gamification in one integrated system. While individual features exist across different products, they have not yet been combined into a single solution. This represents a potential market opportunity for the TRAQUA concept.
At the same time, there is a growing trend toward tracking everyday behavior and focusing more on personal health and wellbeing. People increasingly monitor activity, sleep, and nutrition using digital tools. However, hydration and especially bottle hygiene are often neglected. Studies show that reusable water bottles are frequently not cleaned adequately, which can lead to bacterial growth, and many people drink less water than recommended. Research also demonstrates that digital reminders and tracking apps can significantly increase daily water intake.
These insights highlight the potential for a smart bottle like TRAQUA that combines hydration tracking, water quality monitoring, and bottle hygiene in one system while supporting healthier habits through an intuitive and motivating app.
Project Management
This chapter will provide an overview of the project, addressing scope, time, cost, quality, communication, project plan, sprint scrums, and sprints.
Scope
The project scope (Figure 2) is limited to developing a POC of the smart bottle. The technical focus will be on reading certain minerals from the water and enabling communication with the app. The prototype will be tested in a controlled environment and is not intended for full deployment in a real-life operating environment. In addition to the technical prototype, the project will include a full-scale report on how the bottle should look and function. The report will include recommendations for future development, deployment plans, dataset improvement, integration opportunities, and potential risks.
Project Start: 6th of March 2026 Team Preparedness: The team members should have the required knowledge and skills in configuring ESP32, marketing, ethics, and all the chapters mentioned in the report. Preparatory training or upskilling may be necessary if the team lacks specific expertise. Stakeholder Communication: Establishing effective communication channels with stakeholders, including the client and end-users, is a precondition. Clear communication protocols should be in place to gather feedback and requirements. Risk Assessment and Mitigation Plan: The project needs to perform a risk assessment beforehand to pinpoint potential risks and create plans to manage them. This prepares the project to handle unexpected challenges effectively. Test Environment: It is crucial to have a testing environment for thorough application testing before deploying it. This testing environment needs to closely resemble the final deployment environment.

Time
This subchapter underlines the deadlines that must be met. Documenting key milestones and linking them to specific deadlines is crucial for clarity, accountability, and progress tracking. It ensures that teams stay aligned, allows for the early identification of potential risks, and enables timely adjustments. A well-structured timeline enhances efficiency and significantly increases the likelihood of project success.
Project Duration: 2026-02-23 → 2026-06-25 (123 days / ~17.5 weeks)
The following Table 4 shows all materials to be delivered and their respective delivery dates.
| # | Date | Milestone | Days from start | Risk |
| — | 2026-02-23 | Project start | 0 | — |
| 1 | 2026-02-28 | Choose top 3 projects | 5 | Low |
| 2 | 2026-03-11 | Upload black box diagram and Structural Draft | 16 | Medium |
| 3 | 2026-03-18 | Upload the List of Components and Materials | 23 | High |
| 4 | 2026-03-21 | Define Project Backlog, Global Sprint Plan, Initial Sprint Plan and Release Gantt Chart | 26 | Medium |
| 5 | 2026-03-25 | Upload System Schematics & Structural Drawings + cardboard scale model | 30 | High |
| 6 | 2026-04-12 | Upload Interim Report and Presentation | 48 | Medium |
| 7 | 2026-04-16 | Interim Presentation + feedback | 52 | Low |
| 8 | 2026-04-22 | Upload 3D model video | 58 | Medium |
| 9 | 2026-04-29 | Upload final List of Materials (local providers, price, VAT, transportation) | 65 | High |
| 10 | 2026-05-02 | Upload refined Interim Report (after feedback) | 68 | Low |
| 11 | 2026-05-13 | Upload packaging solution | 79 | Medium |
| 12 | 2026-05-27 | Upload Functional Tests results | 93 | High |
| 13 | 2026-06-13 | Upload Final Report, Presentation, Video, Paper, Poster and Manual | 110 | High |
| 14 | 2026-06-18 | Final Presentation + Individual Discussion + Assessment | 115 | Medium |
| 15 | 2026-06-23 | Wiki/report/paper corrections, refined deliverables, printed poster/brochure/leaflet | 120 | Medium |
| 16 | 2026-06-25 | Prototype demonstration, submit prototype and user manual | 123 | High |
Risk legend:
- Low — Well-defined task, short turnaround, low dependency on external factors.
- Medium — Moderate complexity or dependency on prior deliverables; recoverable if delayed.
- High — Blocks downstream work, depends on external factors (suppliers, hardware, feedback), or has cascading consequences if missed.
High-risk rationale:
- List of Components (2026-03-18) — drives all sourcing and budgeting downstream.
- System Schematics + scale model (2026-03-25) — physical deliverable, hardware/material dependency.
- Final Materials List (2026-04-29) — depends on supplier responses, pricing, VAT, shipping lead times.
- Functional Tests (2026-05-27) — prototype must be working; bugs/hardware failures can cascade.
- Final deliverables bundle (2026-06-13) — largest single upload (report, presentation, video, paper, poster, manual); coordination-heavy.
- Prototype demonstration (2026-06-25) — final, non-recoverable; live hardware failure = project failure.
Costs
Project Budget and Cost Management
The project budget covers the material and component costs for a single smart water bottle. The largest expenses are associated with the custom-manufactured bottle structure and the integrated electronics. Key electronic elements include the microcontroller, TDS sensor (for water quality), FSR406 pressure sensor (for water level), and LIS3DHTR accelerometer (for motion detection). Additional components such as MOSFETs and supporting circuitry are required to ensure safe and reliable operation.The mechanical structure consists of a custom aluminium inner shell, an injection-moulded plastic outer shell with an insulating air gap, the UV-C safety baffle, the activated carbon filter housed inside the cap, threading rings, and the magnets used by the reed-switch kill mechanism. Smaller items such as wires, fuses, and prototyping boards are not included in the budget, as they are available in the university laboratory.
Budget Management
The budget was carefully managed throughout the project lifecycle. Multiple Portuguese suppliers were evaluated to achieve a balance between cost, quality, and delivery time. Where possible, components were sourced from a single supplier to minimize shipping costs. A deliberate decision was made to avoid ordering from China, improving delivery reliability and lead times at the expense of slightly higher costs.In some cases, sourcing from multiple suppliers resulted in increased shipping expenses. Although lower-cost alternatives were available, the team prioritized components that best satisfied the technical requirements and overall system design. The approach focused on maintaining performance while controlling costs where feasible.
Cost Analysis
The total estimated material cost per unit is 155,25 €, exceeding the initial 100 € target by 55,25 € (approximately 50 %). This variance is mainly due to shipping costs, VAT inclusion, and slight underestimations during the planning phase. The deviation remains acceptable at this development stage. Costs will drop significantly once the product moves into mass production, as electronic components are sourced in bulk, custom mechanical parts benefit from amortized tooling, and shipping is consolidated. A reduction of at least 70 € per unit can be expected.
Conclusion
Overall, the budget was effectively controlled, with only a modest increase from the original 100 € estimate. All critical system requirements were successfully achieved. The project highlights the importance of appropriate component selection, supplier management, order consolidation, and leveraging available resources to optimize costs.
Mechanical Components (Per Bottle)
Table 5 compares and discusses the different components.
| Name | Description | Quantity | Unit Price (€) |
| Aluminium inner shell | Custom-formed Al 1050/3003, 0,7 mm wall, polished interior for UV-C reflectivity | 1 | 8,00 |
| Plastic outer shell | Injection-moulded polycarbonate, 2,0 mm wall, with magnet pockets | 1 | 5,50 |
| UV-C safety baffle | Polished aluminium disc, angled, with drinking-channel cutout | 1 | 3,00 |
| Threading rings (top + bottom) | Anodized aluminium threaded collars | 2 | 2,50 |
| Cap assembly | Polycarbonate cap with angled scoop opening + drink nozzle | 1 | 4,00 |
| Activated carbon filter | Filters chlorine & improves taste, housed in cap | 1 | 12,40 |
| Neodymium magnets | N35, 6 mm Ø × 3 mm, for reed-switch kill mechanism | 4 | 0,40 |
| Sealing gaskets / O-rings | Silicone, food-grade, for thread sealing | 2 | 0,60 |
| Mechanical subtotal | 36,40 |
Electrical Components (Per Bottle)
Table 6 shows all the electronical components.
| Name | Description | Link | Quantity | Unit Price (€) |
| TDS sensor | Measures conductivity in the water | Mauser.pt | 1 | 20,59 |
| MOSFET | Works as a switch for the voltage booster | Mauser.pt | 1 | 1,14 |
| Battery | Rechargeable, 3400 mAh, 3.7 V Li-Ion battery | Mauser.pt | 3 | 14,60 |
| BMS | Protects, balances and manages charging of the batteries | Mauser.pt | 1 | 4,23 |
| Battery holder | Holds the batteries and makes battery changing easy | Mauser.pt | 3 | 0,65 |
| Charging port | DC port that connects to the BMS module | Mauser.pt | 1 | 0,92 |
| Buck converter | Step-down for microcontroller (12 V → 5 V) | Mauser.pt | 1 | 1,89 |
| Magnetic reed switch | Switch for the base of the bottle | Mauser.pt | 1 | 2,10 |
| Fuse | Glass fuse 1 A, 5×20 slow blow | Mauser.pt | 1 | 0,18 |
| Fuse holder | Cylindrical fuse holder with threads | Mauser.pt | 1 | 0,57 |
| Breadboard | Protoboard 50×70 for the prototype circuit | Mauser.pt | 1 | 0,95 |
| 1.1 mm wire | Wiring for UV-C light (AWG26) | Mauser.pt | 1 | 1,70 |
| Accelerometer | Senses movement and if the bottle is upright | Kiwi-electronics.com | 1 | 9,53 |
| UV-C LED module | Sterilizes the water | Fruugo.pt | 1 | 8,95 |
| Pressure sensor | Tracks the water amount | Fruugo.pt | 1 | 7,95 |
| Temperature sensor | Measures temperature and humidity | Fruugo.pt | 1 | 7,95 |
| Breadboard kit | Includes wires, resistors, LEDs, etc. | Joom.pt | 1 | 11,90 |
| Microcontroller | ESP32 DEVKIT 1, central control unit | Joom.pt | 1 | 7,30 |
| Charger | 3S 18650 charger, 12.6 V, 2 A | Joom.pt | 1 | 2,50 |
Estimated Cost per Unit
Table 7 visualises the costs per unit.
| Category | Estimated Cost (€) |
| Mechanical Components | 36,40 |
| Electrical Components | 148,50 |
| Total Estimated Cost per Bottle | 184,90 |
| Initial Budget | 100,00 |
| Budget Difference | +84,90 |
Quality
Quality Metrics & Requirements
To ensure the smart water bottle meets all functional, safety, and performance requirements, a set of measurable quality metrics has been defined. These metrics apply to both the prototype and the production design and will be used during testing and validation. Where the prototype and production specifications differ (notably in materials and wall construction), both thresholds are listed.
| Metric | Description | Threshold | Review Method |
|---|---|---|---|
| Physical Dimensions | Bottle must remain practical and portable for daily use | Height 25–27 cm, outer diameter 76–78 mm | Caliper measurement |
| Internal Capacity | Usable water volume must meet design target | 500 ml ± 5 % | Volumetric fill test |
| Wall Construction (Production) | Layered shell with insulating air gap | Aluminum 0.7 mm, air gap 1.0–1.5 mm, plastic 2.0 mm | Cross-section inspection |
| UV-C Reflectivity (Inner Surface) | Polished aluminum interior must reflect UV-C effectively | ≥85 % reflectance at 270 nm | Spectrophotometer or supplier certificate |
| Weight & Ergonomics | Bottle should remain comfortable to carry when empty or full | Empty 300–380 g, full < 900 g | Scale measurement and user handling review |
| Water Quality Monitoring | TDS sensor must provide stable readings | Within ±10 % of calibrated reference | Sensor calibration and comparison |
| Temperature Monitoring | Temperature sensor must provide reliable readings | Within ±2 °C of reference | Reference thermometer comparison |
| Water Level Detection | Pressure sensor must identify fill level states | Empty, half-full, full states detected correctly | Controlled fill testing |
| Motion & Orientation | Accelerometer must detect movement and orientation | Correct detection of movement and upright state | Functional testing |
| Magnet–Reed Switch Alignment | Reed switch must trigger reliably when bottle is assembled | Switch closes within < 1 s of base attachment, in any rotational orientation | Repeated assembly/disassembly cycle testing |
| Energy Efficiency | System must minimize unnecessary power draw | Idle < 100 mW, normal use < 1 W | Power consumption measurement |
| Battery Runtime | Battery must provide practical daily autonomy | 2–7 days per charge depending on usage | Runtime testing |
| Charging Performance | Charging system must safely recharge battery pack | Stable charging with no overheating | Charging cycle observation |
| Water Resistance | Electronics housing must resist splashes and normal cleaning | No internal moisture ingress (IPX4 equivalent) | Splash and sealing inspection |
| UV-C Safety Control | UV-C must only activate in safe operating condition | Activation only when bottle is fully closed and assembled | Safety logic testing |
| UV-C Light Containment | No UV-C must escape the assembled bottle | < 0.1 µW/cm² external emission at 270 nm | UV-C meter measurement |
| Electrical Protection | Internal electronics must be protected from faults | Fuse, BMS, and regulators function correctly | Electrical inspection |
| Mechanical Durability | Bottle must withstand normal daily handling | No damage from 1 m drop test on three axes | Drop test and inspection |
| Thread Sealing | Threaded joints must remain water-tight | No leakage when inverted with full bottle | Inversion leak test |
| User Interface Visibility | LEDs must clearly communicate bottle status | Visible and understandable in normal lighting | Functional review |
| System Reliability | System must operate consistently | Stable operation over 48 h continuous use | Long-duration operation testing |
Review and Validation Process
The table above defines the intended quality requirements and planned validation criteria. Once assembly is complete, all metrics will be reviewed and validated by the project team through practical testing, calibration, inspection, measurement, and functional verification. For the prototype, dimensional and material thresholds reference the prototype's plastic-bottle-with-aluminum-foil construction. For the production design, the same metrics apply to the custom aluminum inner shell with plastic outer shell and air gap, and additional checks are added for UV-C reflectivity, light containment, and magnet–reed switch alignment. The team will record measurement results, compare them with defined thresholds, and identify any deviations. Any requirement that does not meet its target value will be addressed through design improvements, software calibration, or component adjustment before final approval.
Acceptance Criteria
The smart water bottle will be considered acceptable when the project team has verified that all defined quality thresholds are achieved, no functional or safety issues remain, and the magnet–reed switch alignment functions reliably in any assembled orientation.
People & Stakeholder Management
The stakeholder analysis is meant to assist the project group to understand who has interest and power over the project. It is a way to recognise who will be affected by the final product and to be able to categorize everyone involved in order to plan how the project group will interact with them throughout the project.
Based on the Mendelow Matrix 3 will be split into four separate groups: Key Figure, Influencer, Interested and lastly, Spectator. All the stakeholders would be placed against 2 axes, representing their interests and influence. As this is an internal project, the number of stakeholders is limited.
Mendelow Matrix
- Key Figures (High Interest, High Influence): Clients, Lecturers / Coordinator, Project Group
- Influencers (Low Interest, High Influence): ISEP Board, Competitors
- Interested (High Interest, Low Influence): Material Providers, Future Investors
- Spectators (Low Interest, Low Influence): Logistic Partners

Analysis of Stakeholders
Spectators — Logistics Partners: While not directly involved, they may eventually experience benefits from an improved inspection system. However, their role is passive, and they will not influence or interact with the project.
Interested:
- Material Providers: Supply components and materials; their pricing, availability, and lead times directly affect the project budget and timeline.
- Future Investors: Will potentially invest money into the product, so a close eye must be kept on their expectations.
Influencers:
- ISEP Board: Though not actively participating, defines academic frameworks and grading guidelines.
- Competitors: TRAQUA must keep a sharp eye on what competitors develop while keeping their product fresh and at a decent price.
Key Figures:
- Clients: Central to the project's direction and success — they define the problem and validate the solution.
- Lecturers / Coordinator: Advise the group, evaluate project quality, offer ongoing feedback, and determine part of the final grade.
- Project Group: The student developers have the most motivation to succeed and interest in creating a functional system.
Communication Strategy
Each stakeholder group requires a different communication approach based on their position in the Mendelow Matrix. The Table 8 below summarizes how the project group communicates with each party and what is expected in return.
| Stakeholder | Strategy | From us → them | From them → us | Channel | Frequency |
| Clients | Manage Closely | Progress updates, prototype demos, design decisions, clarification requests | Requirements, feedback, validation, priority changes | Meetings, email, demos | Bi-weekly + milestones |
| Lecturers / Coordinator | Manage Closely | Deliverables, reports, presentations, questions | Feedback, grading criteria, guidance, corrections | Scheduled meetings, email, Moodle/wiki uploads | Weekly + each deliverable |
| Project Group | Manage Closely | Task status, blockers, decisions, shared documents | Same — bidirectional | Daily standups, Discord/Teams, Git, shared drive | Daily |
| ISEP Board | Keep Satisfied | Final deliverables, compliance with academic standards | Academic framework, regulations, grading rules | Formal submissions via coordinator | At defined academic checkpoints |
| Competitors | Keep Satisfied (monitor) | No direct communication | Market info gathered via public sources (websites, patents, product releases) | Market research, web monitoring | Monthly scan |
| Material Providers | Keep Informed | Quotes requests, orders, specifications | Pricing, availability, lead times, VAT, shipping | Email, web forms, phone | As needed during sourcing phases |
| Future Investors | Keep Informed | Pitch, final presentation, poster, brochure, leaflet | Interest signals, questions, funding decisions | Final presentation, marketing materials | End of project |
| Logistic Partners | Monitor (minimal effort) | No active communication | Passive — potential future end-users | N/A (indirect) | None during project |
Communication principles:
- Single point of contact: each external stakeholder is handled by one designated team member to avoid mixed messages.
- Documentation: all formal communication (client meetings, lecturer feedback, supplier quotes) is logged in the project wiki.
- Escalation: blockers are raised in the next standup; client/lecturer issues are escalated within 24 h.
- Feedback loop: after each milestone, feedback received is reviewed in the following sprint planning.
Communication
TRAQUA uses a structured set of communication channels, each chosen for a specific purpose: fast internal coordination, formal documentation, stakeholder alignment, and customer engagement.
Internal Team Communication
- WhatsApp — primary channel for day-to-day coordination, quick questions, and informal idea sharing. Fast and low-friction, ideal for immediate feedback.
- Microsoft Teams — used to store documents, organize files, and hold formal online meetings when in-person is not possible. Channels are structured by workstream (e.g., Hardware, Software, Documentation, Marketing).
- Jira — sprint backlog, task assignment, sprint retrospectives, and all sprint-related activities are documented and tracked here. Provides traceability from user story to delivered feature.
- Git (repository) — source code, schematics, and technical drawings are version-controlled. Commit messages reference Jira tickets for traceability.
- Project Wiki — central knowledge base for the report, meeting minutes, decisions, and deliverables.
Communication with Lecturers / Coordinators
Meetings with teachers are organized every Thursday. The team is obliged to share an agenda by Tuesday evening at the latest so that teachers can prepare any necessary materials. These meetings are used to show the team's progress, ask questions, and share ideas.
After each teacher meeting, the team gathers to hold a retrospective and discuss the upcoming sprint (Table 9). Outcomes are logged in Jira and the wiki.
| Item | Detail |
| Frequency | Weekly (Thursday) |
| Agenda deadline | Tuesday 23:59 |
| Channel | In-person / Teams |
| Output | Meeting minutes in wiki, action items in Jira |
| Escalation | Email to coordinator for urgent issues |
Communication with Clients
Clients define the problem and validate the solution, so regular structured contact is essential.
- Bi-weekly progress meetings — demo current state, gather feedback, confirm direction.
- Milestone demos — aligned with major deliverables (interim presentation, functional tests, final prototype).
- Email — for formal questions, requirement clarifications, and document sharing.
- Meeting minutes shared within 24h of each meeting to confirm understanding.
Communication with Suppliers
To maintain good contact with suppliers, regular meetings are planned every one to two months. This allows both the supplier and TRAQUA to gather all their information and questions and discuss everything together, instead of sending scattered emails throughout the week or month. This batching saves everyone from dealing with many small tasks.
- Primary channel: email for quotes, orders, and specifications.
- Backup channel: phone for urgent availability or lead-time issues.
- Single point of contact: one team member owns each supplier relationship to avoid mixed messages.
- Documentation: all quotes, confirmations, and delivery dates are archived in the Teams supplier folder.
Communication with Customers
Customers will have the opportunity to subscribe to a free newsletter that will update them on the company's goals and provide additional composting tips. The application will also include easy access to customer support, ensuring that all customers can reach the company easily.
- Newsletter — monthly, opt-in, covering company updates and composting tips.
- In-app support — chat / contact form for direct questions.
- Social media — for announcements, community engagement, and marketing.
- Response SLA — customer support queries answered within 48h.
Communication with Charities / Partners
To keep charities involved, the company will organize regular meetings with them to discuss relevant topics. This helps maintain strong and high-quality partnerships.
- Frequency: quarterly alignment meetings.
- Purpose: discuss joint initiatives, impact reporting, and upcoming campaigns.
- Channel: in-person or video call, minutes shared afterward.
Communication Tools Summary
The Table 10 below summarizes all the platforms that are used for the communication.
| Tool | Purpose | Audience |
| Fast internal chat | Project Group | |
| Microsoft Teams | File storage, formal meetings | Project Group, Lecturers |
| Jira | Sprint management, task tracking | Project Group |
| Git | Version control (code, schematics) | Project Group |
| Wiki | Documentation, knowledge base | Project Group, Lecturers |
| Formal external communication | Lecturers, Clients, Suppliers | |
| Newsletter | Customer engagement | Customers |
| In-app support | Customer service | Customers |
Communication Principles
- Right channel for the right message: urgent = WhatsApp; formal = email; technical = Jira/Git; knowledge = wiki.
- Asynchronous by default: written communication preferred to respect everyone's schedule; meetings reserved for decisions and alignment.
- Document everything: every meeting produces minutes; every decision is logged.
- Acknowledge receipt: messages requiring action are acknowledged within 24h, even if the full answer comes later.
- No silent blockers: any blocker is raised in the next standup or immediately via WhatsApp if critical.
Communication Risks & Mitigation
The Table 11 below shows the communication risks and mitigations.
| Risk | Impact | Mitigation |
| Message overload on WhatsApp | Important info gets lost | Use Teams/Jira for anything needing traceability; WhatsApp only for quick sync |
| Supplier delays in response | Sourcing timeline slips | Contact multiple suppliers in parallel; escalate after 5 business days of silence |
| Client unavailable for feedback | Design decisions blocked | Book meetings 2 weeks in advance; have a backup decision-maker identified |
| Missed lecturer agenda deadline | Meeting less productive | Recurring Tuesday reminder in team calendar |
| Meeting minutes not documented | Decisions forgotten / disputed | Rotating minute-taker role, published within 24h |
| Single point of failure on a channel | Team member unreachable | Key info duplicated in wiki; no critical info lives only in chat |
Risk Management
This chapter identifies the risks that may arise during the TRAQUA project and defines how they will be prevented, monitored, and managed if they occur. Each risk is assessed on two dimensions: likelihood (how probable it is) and severity (how damaging the impact would be). The product of these two gives a risk score, which determines the priority for mitigation.
Risk Classification
Risks are categorized by type to make it easier to assign ownership and response strategy:
- Project risks — affect schedule, scope, budget, or team capacity
- Technical risks — affect hardware, firmware, software, or integration
- Operational risks — affect day-to-day execution and infrastructure
- Safety & environmental risks — affect user safety, health, or the environment
- Security & data risks — affect confidentiality, integrity, and privacy
Likelihood and Severity Scales
| Level | Likelihood | Severity |
|---|---|---|
| 1 | Improbable | Negligible |
| 2 | Remote | Marginal |
| 3 | Possible | Moderate |
| 4 | Likely | Critical |
| 5 | Frequent | Catastrophic |
Risk score = Likelihood × Severity. Scores are interpreted as:
- 1–4 Low — accept and monitor
- 5–9 Medium — actively mitigate
- 10–15 High — mitigate before development milestones
- 16–25 Critical — must be addressed before the project advances
Risk Register
The Table 13 below lists all identified risks, their assessment, the prevention strategy (applied before the risk occurs), and the response plan (applied if it does occur). Each risk has an assigned owner responsible for monitoring it throughout the project.
| ID | Risk | Category | Likelihood | Severity | Score | Prevention | Response | Owner |
|---|---|---|---|---|---|---|---|---|
| R01 | Common illness | Project | Possible (3) | Marginal (2) | 6 | Good health practices; clear task documentation so work isn't siloed | Redistribute tasks temporarily; extend deadline if critical path affected | Project Manager |
| R02 | Tasks not completed on time | Project | Possible (3) | Moderate (3) | 9 | Realistic planning with buffer; weekly sprint reviews; early flagging of blockers | Replan sprint; reprioritize backlog; notify supervisor | Project Manager |
| R03 | Lack of technical knowledge | Project | Likely (4) | Moderate (3) | 12 | Skills gap analysis at kickoff; training time allocated; mentor/supervisor support | Pair programming; request expert help; simplify scope if blocker persists | Technical Lead |
| R04 | Team member departure | Project | Possible (3) | Critical (4) | 12 | Strong communication; documented processes; cross-training on key tasks | Reassign tasks; revise scope; escalate to supervisor | Project Manager |
| R05 | Loss of data / code | Operational | Remote (2) | Moderate (3) | 6 | Git version control; cloud backups (GitHub + Drive); weekly backup checks | Restore from most recent backup; document lost work | All members |
| R06 | Insufficient testing | Technical | Remote (2) | Critical (4) | 8 | Written test plan; automated tests where possible; peer review of test reports | Extend testing phase; add regression tests; document known issues | Technical Lead |
| R07 | Budget overrun | Project | Possible (3) | Moderate (3) | 9 | Component pricing confirmed before purchase; 15% contingency reserve | Substitute cheaper components; deprioritize non-essential features | Project Manager |
| R08 | Data leaks | Security & data | Likely (4) | Catastrophic (5) | 20 | Encrypted communication (TLS); secure credential storage; input validation; access control on BLE pairing | Revoke affected keys; notify users; patch vulnerability; post-mortem review | Technical Lead |
| R09 | Battery failure / thermal runaway | Safety | Remote (2) | Catastrophic (5) | 10 | Use certified Li-ion cells; include BMS protection circuit; thermal testing during prototype phase | Disconnect battery; trigger product recall procedure if shipped | Hardware Lead |
| R10 | Application downtime | Operational | Frequent (5) | Negligible (1) | 5 | Cloud auto-scaling; health checks; graceful degradation on frontend | Auto-recovery; manual restart if needed; status page notification | Technical Lead |
| R11 | API downtime (third-party) | Operational | Remote (2) | Marginal (2) | 4 | Retry logic with exponential backoff; fallback behaviour; cache recent responses | Switch to fallback; notify users of degraded service | Technical Lead |
| R12 | Battery chemical residue | Safety & environmental | Improbable (1) | Marginal (2) | 2 | Follow electronics safety protocols; use sealed battery compartments | Follow hazardous waste disposal procedure | Hardware Lead |
| R13 | UV-C radiation exposure | Safety | Improbable (1) | Negligible (1) | 1 | N/A for standard operation; enclosures if UV-C modules used | Stop use immediately; consult safety documentation | Hardware Lead |
| R14 | Short circuit | Technical | Improbable (1) | Negligible (1) | 1 | Circuit protection; certified components; PCB design review | Isolate affected unit; check for damage before reuse | Hardware Lead |
| R15 | Supply chain delays (components) | Operational | Possible (3) | Moderate (3) | 9 | Order components early; identify 2+ suppliers per critical part | Substitute equivalent part; adjust schedule; notify supervisor | Hardware Lead |
| R16 | Scope creep | Project | Likely (4) | Moderate (3) | 12 | Clearly defined backlog; change control for new requirements; supervisor sign-off | Push new requests to backlog; renegotiate scope if essential | Project Manager |
| R17 | Sensor calibration drift | Technical | Possible (3) | Moderate (3) | 9 | Use calibrated reference solutions; periodic recalibration; temperature compensation | Recalibrate; flag readings; document drift pattern | Technical Lead |
| R18 | Poor team communication | Project | Possible (3) | Moderate (3) | 9 | Weekly standup; shared tools (Slack/Discord, Trello); written meeting notes | Address in retrospective; adjust communication rhythm | Project Manager |
Risk Matrix
The risk matrix below 4 plots each risk by likelihood (y-axis) and severity (x-axis). Risks in the top-right corner are the highest priority.

Risk Monitoring and Review
Identifying risks once is not enough — they must be tracked throughout the project. The following monitoring process will be applied:
- Weekly risk check during sprint reviews: the team reviews the register and flags any change in likelihood or impact.
- Milestone reassessment: before each major milestone (design review, prototype, interim report, final delivery), the full register is re-evaluated.
- New risk intake: any team member can propose a new risk at any time; the Project Manager assesses it and adds it to the register.
- Closed risks: once a risk is no longer relevant (e.g., a phase is completed), it is marked closed but kept in the register for traceability.
Detailed Risk Descriptions
R08 — Data leaks (score 20, Critical)
The system processes sensitive data — water-quality measurements tied to user accounts and potentially location information. Unauthorized access could affect all users, cause reputational damage, trigger legal liability under GDPR, and erode trust in the product. Likelihood is high because malicious actors routinely target IoT endpoints and mobile APIs, and attack surface grows with user count. Prevention focuses on encryption in transit and at rest, strict access control on BLE pairing, and input validation. If a breach occurs, the response is to revoke affected credentials immediately, notify affected users within the GDPR 72-hour window, patch the vulnerability, and conduct a post-mortem.
R09 — Battery failure (score 10, High)
The TRAQUA device uses a rechargeable Li-ion battery. While rare in modern hardware, thermal runaway can cause physical harm or property damage — making severity catastrophic despite low likelihood. Prevention relies on certified cells with an integrated Battery Management System (BMS), thermal testing during prototyping, and sealed battery compartments. Response: immediate disconnection, and if shipped units are affected, a recall procedure in coordination with the supervisor.
R03 — Lack of technical knowledge (score 12, High)
The project combines electronics, firmware (ESP32), mobile app development, and sensor calibration — a broad stack that no single team member fully masters at the start. Prevention is done through a skills gap analysis at kickoff, allocated training time in the first sprints, and proactive use of the supervisor and external mentors. If a specific blocker arises during development, the response is pair programming, requesting expert help, or simplifying scope on the affected feature rather than letting it block the critical path.
R16 — Scope creep (score 12, High)
As the project progresses, stakeholders or team members may propose new features that seem small individually but collectively derail the schedule. Prevention is a clearly defined backlog with supervisor-approved scope, and a change-control rule: any new requirement is added to the backlog, not to the current sprint. Response: if a new request is genuinely essential, an existing item is removed to make room, keeping total scope constant.
R04 — Team member departure (score 12, High)
If a team member drops out mid-project, remaining members absorb their workload, which can cascade into further delays. Prevention relies on documentation (so no knowledge is locked in one person's head), cross-training on critical tasks, and early warning signs picked up in weekly retrospectives. Response: immediate task reassignment, scope revision if needed, and escalation to the supervisor.
Procurement
Procurement Management Strategy
The procurement strategy was designed to ensure that all required components are available on time and that the project can progress without delays. The main focus was on selecting components that are reliable, compatible, and easy to obtain within the project timeframe.
Each component was reviewed before ordering to confirm that it meets the system requirements and can be integrated without issues. This reduced the risk of delays caused by incorrect or incompatible parts and helped keep the procurement process organized.
Make vs Buy Decisions
Most components were purchased, especially electronic parts such as sensors, the microcontroller, and the display. These components require precise manufacturing and are not practical to produce within the project.
Some mechanical aspects, such as the internal mounting and positioning of components inside the bottle, were designed and assembled by the team. This allowed flexibility during prototyping and made it easier to adjust the design when needed.
Suppliers and Procurement Planning
Suppliers were selected based on availability, delivery time, and reliability. Multiple suppliers were used to ensure that all required components could be sourced without delays. Preference was given to suppliers that provide clear specifications and consistent stock levels.
Procurement was carried out in phases. Components needed for early testing were ordered first, allowing development and prototyping to begin as soon as possible. Less critical components were ordered later, once the design was more finalized. This approach reduced the risk of ordering unnecessary or incompatible parts.
Risk Management
To reduce procurement risks, alternative components and backup suppliers were identified for critical parts. Datasheets were carefully reviewed before ordering to ensure compatibility. Procurement was started early to allow enough time to handle delays, missing parts, or specification issues.
This structured approach ensured a smooth procurement process and supported steady project progress.
Procurement Table
The procurement is shown in Table 14.
| Item | Supplier | Backup Supplier | Manufacturer | Quantity | Lead Time (Days) | Notes |
|---|---|---|---|---|---|---|
| TDS Sensor (SEN0244) | Mauser | DigiKey | TPXCKZ | 1 | 2–4 | Water quality measurement |
| MOSFET (IRLZ44N) | Mauser | DigiKey | Infineon | 1 | 1–3 | Switching component |
| Battery (NCR18650B) | Mauser | Grandado | Panasonic | 3 | 2–4 | 3S pack power supply |
| BMS (3S) | Mauser | DigiKey | Generic | 1 | 2–4 | Battery protection and balancing |
| Battery Holder (1×18650) | Mauser | Farnell | Generic | 3 | 2–4 | Cell mounting |
| Charging Port (DC connector) | Mauser | DigiKey | Generic | 1 | 2–4 | External charger input |
| Buck Converter (LM2596) | Mauser | Grandado | Generic | 1 | 2–4 | 12 V → 5 V regulation |
| Magnetic Reed Switch (SPST-NO) | Mauser | Farnell | Generic | 1 | 2–4 | Circuit-killer at bottle base |
| Fuse (1 A, 5×20 slow blow) | Mauser | DigiKey | Eska | 1 | 1–3 | Overcurrent protection |
| Fuse Holder (5×20) | Mauser | Farnell | Generic | 1 | 1–3 | Fuse mounting |
| Breadboard (Protoboard 50×70) | Mauser | DigiKey | Generic | 1 | 1–3 | Prototype circuit board |
| 1.1 mm Wire (AWG26) | Mauser | DigiKey | Goobay | 1 | 1–3 | UV-C light wiring |
| Accelerometer (LIS3DHTR) | Kiwi Electronics | Farnell | STMicroelectronics | 1 | 3–6 | Motion and orientation detection |
| UV-C LED Module | Fruugo | DigiKey | Generic | 1 | 5–8 | Water sterilisation |
| Pressure Sensor (FSR406) | Fruugo | Fruugo | JETTING | 1 | 5–8 | Water level measurement |
| Temperature Sensor (KY-015 DHT) | Fruugo | Fruugo | AOKIN | 1 | 5–8 | Temperature and humidity sensing |
| Breadboard Kit | Joom | Fruugo | Generic | 1 | 5–10 | Wires, resistors, LEDs, etc. |
| Activated Carbon Filter | Joom | Fruugo | Generic | 1 | 5–10 | Improves taste |
| Microcontroller (ESP32 DevKit V1) | Joom | Fruugo | Espressif | 1 | 5–10 | Main controller |
| Charger (3S 12.6 V / 2 A) | Joom | Worten | Generic | 1 | 5–10 | External battery pack charger |
| Total Components | - | - | - | 22 items | - | All required parts |
Project Plan
The project was structured across eight sprints, preceded by a pre-work phase dedicated to topic selection and initial setup. Each sprint spans approximately one week, running from early March to late June 2026. Project management was handled in Jira, where all tasks were tracked and assigned across the team. The Gantt chart provides a visual overview of the planned timeline, grouping activities by sprint and category.
The pre-work phase covered foundational Scrum activities — stand-ups, retrospectives, and sprint demos — as well as general activities including role assignment. Sprint 1 focused on initial research, documentation, and structural work. Subsequent sprints progressively addressed design, prototyping, coding, and testing. The final sprints are dedicated to the interim and final reports, functional tests, packaging solutions, and multimedia deliverables such as the video, flyer, and poster. This iterative approach allowed the team to review progress regularly through retrospectives and adapt the backlog accordingly, ensuring continuous alignment with project goals.
Figure 5 shows the timeline and backlog with epics in Jira. Some timeline start and end dates are not visible, as the corresponding user stories have either not started yet or have already been completed. Dates in Jira were aligned with the deliverable deadlines defined in the Time chapter.

Figures 6 and 7 present the same schedule as a Gantt chart produced in Excel, offering an alternative view to the Jira timeline.


Gantt Chart and Key Project Phases
The project timeline spans from late February 2026 to late June 2026, structured across eight iterative sprints plus a pre-work phase. The Gantt chart illustrates the full schedule, with tasks grouped by sprint and color-coded by category. The project was divided into five key phases:
- Pre-work and Setup (Feb 23 – Mar 5): project selection, initial Scrum setup, role assignment, and backlog definition. Milestone: top-3 project proposals submitted by February 28.
- Research and Documentation (Sprint 1–2, Mar 5–19): research on water quality and filtration, black box system diagram and structural drafts (milestone: March 11), and the initial list of components and materials (milestone: March 18).
- Design and Intermediate Deliverables (Sprint 3–4, Mar 19 – Apr 16): detailed system schematics, structural drawings, cardboard modelling (milestone: March 25), Gantt chart and sprint plan publication (milestone: March 21), Interim Report and Presentation submission (milestone: April 12), and the Interim Presentation event (milestone: April 16).
- Prototyping and Development (Sprint 5–6, Apr 16 – May 27): 3D model video (milestone: April 22), final materials list (milestone: April 29), refined interim report (milestone: May 2), backend and frontend coding, ESP32 integration, agent connectivity, and packaging solutions (milestone: May 13). Functional tests concluded and uploaded by May 27.
- Final Deliverables and Presentation (Sprint 7–8, Jun 1–25): final report, paper, video, poster, and manual (milestone: June 13), final presentation and individual assessment (milestone: June 18), corrected and refined deliverables (milestone: June 23), and prototype demonstration to the client (milestone: June 25).
Mapping the Plan to Iterative Sprints
The project was managed using an agile Scrum framework, with each week constituting a new sprint. Each sprint followed a consistent structure: a planning session at the start, daily stand-ups throughout, and a retrospective and sprint demo at the end. This iterative approach allowed the team to regularly assess progress, incorporate teacher and peer feedback, and adjust priorities accordingly.
The product backlog was defined during the pre-work phase and broken down into sprint backlogs at the start of each sprint. Each sprint had a clear goal aligned with the upcoming milestone deadlines.
Backlog Management
The backlog was managed exclusively in Jira. At the beginning of each sprint, the team held a planning session to select tasks based on priority and the upcoming milestones. Each task was assigned to a team member and tagged with its parent epic (e.g., Research, Design, Documents, Code, Prototype, Tests, Interim Report).
During the sprint, tasks moved through four states: To Do, In Progress, In Review, and Done. Tasks not completed by the end of a sprint were reviewed in the retrospective and either carried over to the following sprint or re-prioritized in the backlog.
Prioritization
Prioritization was driven primarily by milestone deadlines defined in the Time chapter. Tasks blocking an upcoming deliverable (e.g., the Interim Report on April 12) were assigned the highest priority, regardless of their epic. Within a single sprint, the team applied a simple MoSCoW-style logic:
- Must have: tasks on the critical path to the next milestone.
- Should have: tasks improving deliverable quality but not blocking submission.
- Could have: nice-to-have improvements deferred if capacity ran short.
- Won't have (this sprint): items pushed to a later sprint or the backlog.
External dependencies (component delivery times, supplier responses, lecturer feedback) were also considered, with dependent tasks scheduled only after their inputs were confirmed available.
Estimation
Tasks were estimated in story points during sprint planning, with the team converging on a value through brief discussion rather than formal planning poker. The total points committed per sprint ranged from roughly 30 to 50, depending on team availability and the complexity of upcoming deliverables.
Two main challenges emerged with estimation. First, the team's mixed academic backgrounds made it difficult to estimate cross-disciplinary tasks consistently — a task that seemed small to one member could be substantial for another. This was addressed by having the assigned member propose the initial estimate and the rest of the team challenge it only when there was strong reason to.
Second, in early sprints the team noticed that story points were marked as burned down before all sub-tasks of a parent story were closed, which distorted burndown charts. Following Sprint 3, the Definition of Done was updated to require all sub-tasks to be closed before the parent story could be moved to Done, restoring burndown accuracy in subsequent sprints.
Mapping the Plan to Iterative Sprints
The project was managed using an agile Scrum framework, with each week constituting a new sprint. Each sprint followed a consistent structure: a planning session at the start, daily stand-ups throughout, and a retrospective and sprint demo at the end. This iterative approach allowed the team to regularly assess progress, incorporate feedback, and adjust priorities accordingly.
The product backlog was defined during the pre-work phase and broken down into sprint backlogs at the start of each sprint. Each sprint had a clear goal aligned with the upcoming milestone deadlines.
The backlog was managed exclusively in Jira. At the beginning of each sprint, the team held a planning session to select tasks based on priority and the upcoming milestones. Each task was assigned to a team member and tagged with its parent epic (e.g., Research, Design, Documents, Code, Prototype, Tests, Interim Report). During the sprint, tasks moved through four states: To Do, In Progress, In Review, and Done. Tasks not completed by the end of a sprint were reviewed in the retrospective and either carried over to the following sprint or re-prioritized in the backlog.
Prioritization and estimation are described in detail in the Project Plan section above.
Sprint Overviews
Sprint 1: Foundation & Research
Period: March 5, 2026 – March 12, 2026
Sprint 1 8 was characterized by a heavy “Discovery” phase. The team focused on setting up the technical environment (TRAQ-43) and conducting deep-dive research into water quality and filtration systems. Because this was the inaugural sprint, a significant amount of time was spent refining the backlog and defining the complexity of the Interim Report. The team considered a total of 40 story points. The team assigned a total of 43 Story points. Its the first week of discovery, so the main goal here was to discuss and gather as much information as possible about the possible topic and come up with the top 3 topic we would like to work on.
Key work streams Environmental Setup: Establishing the Scrum framework and project architecture. Technical Research: Analyzing water levels and filtration logic (TRAQ-11 through 14). Documentation: Initial drafting of the Background and Related Work sections for the interim report.

Sprint 2: Core Development and Reporting
Period: Thursday, March 12th – Wednesday, March 19th, 2026 Sprint 2 9 followed a Thursday-to-Wednesday cycle. This schedule proved challenging due to a school trip on Friday followed immediately by the weekend, which created an unavoidable “stagnation period” at the very start of the sprint where no points could be burned down. The story point total rose to 50 this sprint. This was because we had now chosen our topic and needed to research how and what exactly we wanted to apply, and how we wanted to execute it. Toward the end of the sprint the chart rises again. This was caused by a misunderstanding about how to close a story when not all of its sub-stories were finished.

Sprint 3 Strategic Completiong & Prototyping
Period: March 19th, 2026 – March 26th, 2026
Narrative Summary Sprint 3 10 marked a transition from theoretical research to tangible outputs. The team successfully cleared the “documentation backlog” by finalizing heavy-weight chapters of the Interim Report. Simultaneously, the project moved into the design and physical modeling phase, with the creation of structural drawings and a physical cardboard model to validate the system's dimensions.
Technical Learning Point The team identified a discrepancy in how Story points are calculated when sub-tasks remain open. Moving forward, the Definition of Done (DoD) has been updated to ensure all granular tasks are closed before the parent Story is moved to “Done” to maintain burndown accuracy.
Story points went up to 58.5. The team started to incorporate daily meetings each meeting gets 0.5 story points. Also we were able to increase the workload because we had less classes. Our objective is to work more in the beginning and less at the end. Start with full power and then be more relaxed at the end. This sprint also had a lot of story points, as there were a lot of deliverables to be handed in.

Sprint 4: Interim Presentation and Interim Report
Period: March 26th, 2026 – April 1st, 2026
Sprint Goal: Finish up the Interim Report.
Sprint 4 11 was the final push toward a major project milestone. The team's efforts were almost entirely dedicated to consolidating research and development into the Interim Presentation and finalizing the core technical chapters of the report. This sprint confirmed the total unviability of the “Thursday-start” schedule, as the pressure to deliver high-point items was concentrated entirely into the final two days of the cycle.
Story point stats consistent with 53.5. Nothing major to add here. One thing to point out is that each sprint task gets finished up “later” because we start sprints on Thursday, meaning we have a straight-away weekend on our hands, followed by 3 working days.

Sprint 5: Interim Report Hand-in and Presentation Prep
Period: April 1st, 2026 – April 13th, 2026 Sprint Goal: Hand in the Interim Report. Sprint 5 12 was originally scheduled to end earlier, but the team extended it by two days for two reasons: a vacation period fell near the original end date, and the new end date was aligned with the scheduled meeting with the teachers, giving the team additional time to prepare for the Interim Report presentation. The sprint started with a commitment of 32 story points, which grew to 33.5 after TRAQ-164 (“Table of power budget”, 1.5 pts) was added to scope on the first day. The team closed out 21.5 points across 7 work items, including the report hand-in itself (TRAQ-155), the Interim Report (TRAQ-20, 10 pts), Schematics Version 3, the Website, the Application Prototype, and Retrospective 5. TRAQ-88 (“Chapter Project Management”, 12 pts) remained in progress and carried over to Sprint 6. The burndown tracked below the ideal guideline through most of the sprint, with the steepest drop between April 8–10 as the interim report deliverables were finalized.

Sprint 6: Post-Interim Recovery and Final Push Preparation
Period: April 16th, 2026 – April 28th, 2026
Sprint Goal: Address feedback from the Interim Report and prepare deliverables for the final stretch.
Sprint 13 displayed the most extreme “late-crunch” pattern of the project so far. The remaining work stayed flat at the initial commitment of 40 story points until April 20th, with the entire burndown collapsing into a 2-day window between April 22nd and April 24th. The team closed 24.5 points across 9 work items, including the 3D model video (TRAQ-21, 8 pts), the report fixes following interim feedback (TRAQ-168, 8 pts), the leaflet, the poster, the smart system schematics review, the video addition, the lab parts check, three daily meetings, and Retrospective 6. TRAQ-88 (“Chapter Project Management”, 12 pts) remained in progress as expected — this item is intentionally kept open across sprints since new content is added to it on every cycle, and it will only be closed at the end of the project. The flat-then-cliff burndown shape reflects the team prioritizing deep work on the larger report and design items before logging completions in a single batch near the end of the sprint, rather than a true delivery delay.
The burndown opened at roughly 40 story points and stayed flat until April 20. Almost all progress was logged in a single batch around April 23, dropping the remaining work to about 15 points — meaning the team closed roughly 25 points but finished above the ideal guideline, with the rest (chiefly TRAQ-88) carried into the next sprint.

Sprint 7: Mid-Project Deliverables
Period: April 23rd, 2026 – April 30th, 2026
Sprint Goal: Continue progress on project deliverables following the interim milestone.
The Sprint that is shown in figure 14 was the shortest sprint so far at one week, a tighter cadence following the interim report milestone. The sprint started with a commitment of approximately 23 story points. The burndown once again exhibited the team's characteristic “late-crunch” pattern: remaining work stayed flat from April 23rd through April 27th, dropped by a small amount on April 27th, then plateaued again before the bulk of completions were logged on the final day, April 30th. By the end of the sprint window shown, roughly 9 points had been burned down, leaving approximately 14 points still in progress at the time of capture. As in previous sprints, TRAQ-88 (“Chapter Project Management”) is expected to remain open by design, since content continues to be added to it across every sprint and will only close at the end of the project.
With an increase in classes, the team's total workload dropped to 23.5. This is also because the team focused on smaller tasks like Paper etc.

Sprint 8
Sprint 8 in figure 15 covered the period from April 30th to May 14th, 2026, with an initial workload of approximately 61 story points. The burndown chart showed a typical late-crunch pattern: after a small reduction at the start of the sprint, progress stayed mostly flat until May 12th, when most tasks were completed. By the end of the sprint, the remaining workload had decreased to around 23 story points, showing significant progress despite work being completed mainly at the end of the sprint.
Major deadlines this week, so the workload increased to 60. Meet Sprint, a bug came up hence, the chart is going back up.

Sprint 9
Sprint 9 in figure 16 covered the period from May 14th to May 21st, 2026, with an initial workload of approximately 55 story points. The burndown chart showed very limited progress during most of the sprint, with only small reductions in remaining work occurring near the end of the sprint period. By the end of the sprint, the workload had decreased to around 43 story points, indicating that only a small portion of tasks was completed during this sprint. The burndown remained far above the ideal progression line throughout the sprint, suggesting that several tasks were still ongoing at the time of capture.
Back to the regular ~50 sprint points. The task that never gets finished is Project Management, as each week we need to add more to it. The teachers also asked us to add more to the app and paper, which is why there is such a big gap in the sprint backlog

Sprint 10
Sprint 10 in Figure 17 covered the period from May 21st to May 28th, 2026, with an initial workload of approximately 45 story points. Unlike previous sprints, progress was more evenly distributed throughout the week, with several reductions in remaining work occurring at different points rather than only at the end of the sprint. The workload gradually decreased from 45 to approximately 3 story points by the end of the sprint, indicating that almost all planned tasks were completed. The final sharp drop suggests that the last remaining deliverables were closed just before the sprint ended, leaving only a minimal amount of work still in progress.

Sprint 11
Sprint 11 in Figure 18 covered the period from May 28th to June 4th, 2026, with an initial workload of approximately 50 story points. The burndown chart showed little progress during the first half of the sprint, followed by several significant reductions in remaining work between June 2nd and June 4th. By the end of the sprint, the workload had decreased to approximately 8 story points, indicating that most of the remaining tasks were completed. As in several previous sprints, a large portion of the work was finalized near the end of the sprint, resulting in a burndown pattern that remained above the ideal progression line until the final days.

Sprint 12
Sprint 12 in Figure 19 covered the period from June 4th to June 11th, 2026, with an initial workload of approximately 31 story points. The burndown chart showed steady progress throughout the sprint, with several small reductions in remaining work occurring at regular intervals rather than being concentrated on the final day. By the end of the sprint, the remaining workload had decreased to approximately 14 story points. Although the team did not fully reach the ideal burndown line, the sprint demonstrated a more consistent completion of tasks compared to earlier sprints, reflecting a gradual closing of the remaining project activities.
A major drop in time as the team project is coming up to an end. Small tasks are remaining.

Sprint Outcomes
Sprint 1
This subchapter documents the outcome of sprint 1.
The following Table 15 shows the outcome of sprint 1.
| Sprint | Task | Duration | Responsible | Involved |
| 23/02/2026 - 04/03/2026 | ||||
| 1 | Set up the Scrum environment | Bernardo Josué Corr. | Everyone | |
| 1 | Chapter 2 Background and Related Work | Rieke Platthaus | Everyone | |
| 1 | Filter analyse 2 | Bernardo Josué Corr. | Everyone | |
| 1 | Filter analyse 1 | Ines Margand | Everyone | |
| 1 | Level of water analyse 2 | Maria Włodarczyk | Everyone | |
| 1 | Level of water analyse 1 | Guillem Vázquez Rol. | Everyone | |
| 1 | Structural Draft | Guillem Vázquez Rol. | Everyone | |
| 1 | BlackBox Diagram | Maximilian Salmi | Everyone | |
| 1 | Level of water | Maximilian Salmi | Everyone | |
| 1 | Quality of water research | Rieke Platthaus | Everyone | |
| 1 | Research Filters | Ines Margand | Everyone | |
Sprint 1 Summary:
Main Achievements:
- Set up the Scrum environment and established the project foundation.
- Completed initial research on water filters, water quality, and water level analysis.
- Produced the Structural Draft and BlackBox Diagram, and drafted the Background/Related Work chapter.
Progress Check: 100% of the planned work for this sprint is finished.
Effort Breakdown:
- Tasks Planned: 11
- Tasks Finished: 11
Sprint 2
This subchapter documents the outcome of sprint 2.
The following Table 16 shows the outcome of sprint 2.
| Sprint | Task | Duration | Responsible | Involved |
| 05/03/2026 - 11/03/2026 | ||||
| 2 | Research possible solutions for UV-C protection | Bernardo Josué Corr. | Everyone | |
| 2 | Graphic Design | Guillem Vázquez Rol. | Everyone | |
| 2 | Update the report with feedback | Bernardo Josué Corr. | Everyone | |
| 2 | Update report | Rieke Platthaus | Everyone | |
| 2 | Make a list of materials | Ines Margand | Everyone | |
| 2 | Spec table with different information | Maximilian Salmi | Everyone | |
| 2 | Retrospectives 2 | Bernardo Josué Corr. | Everyone | |
| 2 | Chapter 7 Project Development | Guillem Vázquez Rol. | Everyone | |
| 2 | Chapter 6 Ethical and Deontological Concerns | Rieke Platthaus | Everyone | |
| 2 | Chapter 5 Eco-efficiency Measures for Sustainability | Rieke Platthaus | Everyone | |
| 2 | Chapter 4 Marketing Strategy Development | Maria Włodarczyk | Everyone | |
| 2 | Chapter 2 Background and Related Work | Rieke Platthaus | Everyone | |
Sprint 2 Summary:
Main Achievements:
- Researched UV-C protection solutions and produced the materials list and specification table.
- Updated the report based on feedback and developed multiple report chapters (Marketing Strategy, Eco-efficiency, Ethical Concerns, Project Development).
- Completed graphic design work and conducted Retrospective 2.
Progress Check: 100% of the planned work for this
Sprint 3
This subchapter documents the outcome of sprint 3.
The following Table 17 shows the outcome of sprint 3.
| Sprint | Task | Duration | Responsible | Involved |
| 12/03/2026 - 18/03/2026 | ||||
| 3 | Daily meeting 25/03/2026 | Bernardo Josué Corr. | Everyone | |
| 3 | Daily meeting 23/03/2026 | Bernardo Josué Corr. | Everyone | |
| 3 | Daily meeting 20/03/2026 | Bernardo Josué Corr. | Everyone | |
| 3 | Companies research | Unassigned | Everyone | |
| 3 | Update background materials research | Ines Margand | Everyone | |
| 3 | Cardboard Model | Ines Margand | Everyone | |
| 3 | Practical solution for 3d system | Maximilian Salmi | Everyone | |
| 3 | QR code to Wiki | Bernardo Josué Corr. | Everyone | |
| 3 | Chapter Project Management | Ines Margand | Everyone | |
| 3 | Flyer | Bernardo Josué Corr. | Everyone | |
| 3 | Retrospective 3 | Bernardo Josué Corr. | Everyone | |
| 3 | Chapter 7 Project Development | Guillem Vázquez Rol. | Everyone | |
| 3 | Chapter 6 Ethical and Deontological Concerns | Rieke Platthaus | Everyone | |
| 3 | Chapter 4 Marketing Strategy Development | Maria Włodarczyk | Everyone | |
| 3 | Chapter 2 Background and Related Work | Rieke Platthaus | Everyone | |
| 3 | Structural Drawings | Guillem Vázquez Rol. | Everyone | |
Sprint 3 Summary:
Main Achievements:
- Built the Cardboard Model and developed the practical solution for the 3D system.
- Conducted companies research, updated background materials research, and produced the Flyer and Structural Drawings.
- Added the QR code to the Wiki, advanced multiple report chapters, and held daily stand-ups and Retrospective 3.
Progress Check: 100% of the planned work for this sprint is finished.
Effort Breakdown:
- Tasks Planned: 16
- Tasks Finished: 16
Sprint 4
This subchapter documents the outcome of sprint 4.
The following Table 18 shows the outcome of sprint 4.
| Sprint | Task | Duration | Responsible | Involved |
| 19/03/2026 - 25/03/2026 | ||||
| 4 | Chapter Project Management | 12 | IM | Everyone |
| 4 | Interim Report | 10 | RP | Everyone |
| 4 | Chapter 7 Project Development | 8 | GR | Everyone |
| 4 | Chapter 2 Background and Related Work | 9 | RP | Everyone |
| 4 | Retrospective 4 | 0.5 | BA | Everyone |
| 4 | Interim Presentation | 10 | BA | Everyone |
| 4 | Daily meeting 30/03/2026 | 0.5 | MS | Everyone |
| 4 | Daily meeting 31/03/2026 | 0.5 | MW | Everyone |
| 4 | Schematics Version 2 | 3 | MS | Everyone |
Sprint 4 Summary:
Main Achievements:
- Completed the Interim Report and Interim Presentation, including the Background/Related Work and Project Development chapters.
- Finalized Schematics Version 2 and conducted Retrospective 4.
- Held daily stand-up meetings to track progress.
Progress Check: ~89% of the planned work for this week is finished; the Chapter Project Management item remains in progress.
Effort Breakdown:
- Tasks Planned: 9
- Tasks Finished: 8
Sprint 5
This subchapter documents the outcome of sprint 5.
The following Table 19 shows the outcome of sprint 5.
| Sprint | Task | Duration | Responsible | Involved |
| 26/03/2026 - 01/04/2026 | ||||
| 5 | Chapter Project Management | 12 | IM | Everyone |
| 5 | Interim Report | 10 | RP | Everyone |
| 5 | Schematics Version 3 | 3 | GR | Everyone |
| 5 | HAND IN REPORT | 0.5 | BA | Everyone |
| 5 | Retrospective 5 | 0.5 | MW | Everyone |
| 5 | Website | 3 | BA | Everyone |
| 5 | Application Prototype | 3 | BA | Everyone |
| 5 | Table of power budget | 1.5 | MS | Everyone |
Sprint 5 Summary:
Main Achievements:
- Finalized and handed in the Interim Report and produced Schematics Version 3.
- Built the Website and Application Prototype, and created the power budget table.
- Conducted Retrospective 5; the Chapter Project Management item remains in progress.
Progress Check: ~89% of the planned work for this sprint is finished; Chapter Project Management is still in progress.
Effort Breakdown:
- Tasks Planned: 8
- Tasks Finished: 7
Scope Changes: TRAQ-164 (Table of power budget) was added after sprint start, increasing commitment by 1.5 story points (total 33.5).
Sprint 6
This subchapter documents the outcome of sprint 6.
The following Table 20 shows the outcome of sprint 6.
| Sprint | Task | Duration | Responsible | Involved |
| 16/04/2026 - 22/04/2026 | ||||
| 6 | Chapter Project Management | 12 | IM | Everyone |
| 6 | Video add | 2 | MW | Everyone |
| 6 | Check lab for pieces | 1 | MS | Everyone |
| 6 | 3D model video | 8 | GR | Everyone |
| 6 | Retrospective 6 | 0.5 | RP | Everyone |
| 6 | Daily Meeting 22/04/2026 | 0.5 | GR | Everyone |
| 6 | Daily Meeting 21/04/2026 | 0.5 | MS | Everyone |
| 6 | Daily meeting 20/04/2026 | 0.5 | MW | Everyone |
| 6 | Fix report after Interm report | 8 | RP | Everyone |
| 6 | Leeflet | 3 | MW | Everyone |
| 6 | Review Smart system schematics | 2 | MS | Everyone |
| 6 | Poster | 2 | IM | Everyone |
Sprint 6 Summary:
Main Achievements:
- Produced the 3D model video, Leaflet, and Poster, and fixed the report after the interim feedback.
- Reviewed the Smart System schematics, added the video, and checked the lab for pieces.
- Held daily stand-ups and Retrospective 6; Chapter Project Management remains in progress.
Progress Check: ~92% of the planned work for this sprint is finished; Chapter Project Management is still in progress.
Effort Breakdown:
- Tasks Planned: 12
- Tasks Finished: 11
Sprint 7
This subchapter documents the outcome of sprint 7.
The following Table 21 shows the outcome of sprint 7.
| Sprint | Task | Duration | Responsible | Involved |
| 23/04/2026 - 29/04/2026 | ||||
| 7 | Chapter Project Management | 3 | IM | Everyone |
| 7 | Packing solutions | 6 | IM | Everyone |
| 7 | Paper | 5 | RP | Everyone |
| 7 | Check lab for pieces | 1 | MS | Everyone |
| 7 | Video add | 3 | MW | Everyone |
| 7 | Final list of material and components | 2 | MS | Everyone |
| 7 | Retrospective 7 | 0.5 | IM | Everyone |
| 7 | Daily Meeting 24/04/2026 | 0.5 | IM | Everyone |
| 7 | Daily Meeting 28/04/2026 | 0.5 | GR | Everyone |
| 7 | Daily Meeting 29/04/2026 | 0.6 | MS | Everyone |
| 7 | Add small details for 3d Video | 1 | BA | Everyone |
Sprint 7 Summary:
Main Achievements:
- Developed packing solutions and finalized the list of materials and components.
- Advanced the Paper, refined the 3D video with additional details, and completed the video add.
- Held daily stand-ups and Retrospective 7; Chapter Project Management remains in progress.
Progress Check: ~73% of the planned work for this sprint is finished; Chapter Project Management, Packing solutions, and Paper remained open at sprint close.
Effort Breakdown:
- Tasks Planned: 11
- Tasks Finished: 8
Sprint 8
This subchapter documents the outcome of sprint 8.
The following Table 22 shows the outcome of sprint 8.
| Sprint | Task | Duration | Responsible | Involved |
| 07/05/2026 - 13/05/2026 | ||||
| 8 | Chapter Project Management | 3 | IM | Everyone |
| 8 | Paper | 20 | RP | Everyone |
| 8 | Packing solutions | 6 | IM | Everyone |
| 8 | Retrospective 8 | - | RP | Everyone |
| 8 | Establish the costs for the aluminum bottle and plastic | 8 | BA | Everyone |
| 8 | 3D Model | 10 | GR | Everyone |
| 8 | Reviews the excel lists | 5 | MS | Everyone |
| 8 | Daily meeting 12/05/2026 | 0.5 | MW | Everyone |
| 8 | Daily meeting 13/05/2026 | 0.5 | GR | Everyone |
| 8 | Daily meeting 11/05/2026 | 0.5 | MS | Everyone |
| 8 | Deliver interm report after feedback | 8 | MW | Everyone |
Sprint 8 Summary:
Main Achievements:
- Built the 3D Model and established costs for the aluminum bottle and plastic.
- Delivered the interim report after feedback, reviewed the Excel lists, and progressed the Paper and packing solutions.
- Held daily stand-ups and Retrospective 8; Chapter Project Management remains in progress.
Progress Check: ~82% of the planned work for this sprint is finished; Chapter Project Management and Paper remained open at sprint close.
Effort Breakdown:
- Tasks Planned: 11
- Tasks Finished: 9
Sprint 9
This subchapter documents the outcome of sprint 9.
The following Table 23 shows the outcome of sprint 9.
| Sprint | Task | Duration | Responsible | Involved |
| 14/05/2026 - 20/05/2026 | ||||
| 9 | Chapter Project Management | 3 | IM | Everyone |
| 9 | Paper | 20 | RP | Everyone |
| 9 | App | 10 | BA | Everyone |
| 9 | Manuel | 4 | MW | Everyone |
| 9 | Retrospective 9 | 0.5 | MS | Everyone |
| 9 | 3D Printing | 5 | GR | Everyone |
| 9 | Fix packing Poster | 1 | IM | Everyone |
| 9 | Hardware configuration | 10 | MS | Everyone |
| 9 | Daily meetings 15/05/2026 | 0.5 | BA | Everyone |
| 9 | Daily meeting 18/05/2026 | 0.5 | RP | Everyone |
| 9 | Daily meeting 19/05/2026 | 0.5 | GR | Everyone |
Sprint 9 Summary:
Main Achievements:
- Completed 3D printing, hardware configuration, and the user Manual.
- Fixed the packing poster and progressed the Paper and App.
- Held daily stand-ups and Retrospective 9; Chapter Project Management remains in progress.
Progress Check: ~82% of the planned work for this sprint is finished; Chapter Project Management, Paper, and App remained open at sprint close.
Effort Breakdown:
- Tasks Planned: 11
- Tasks Finished: 8
Sprint 10
This subchapter documents the outcome of sprint 10.
The following Table 24 shows the outcome of sprint 10.
| Sprint | Task | Duration | Responsible | Involved |
| 21/05/2026 - 27/05/2026 | ||||
| 10 | Chapter Project Management | 3 | IM | Everyone |
| 10 | Paper | 20 | RP | Everyone |
| 10 | App | 10 | BA | Everyone |
| 10 | Retrospective 10 | 1 | IM | Everyone |
| 10 | Stress test | 5 | GR | Everyone |
| 10 | Test of components | 5 | MS | Everyone |
| 10 | Soldering | 1 | MS | Everyone |
| 10 | Overview Paper hand in | - | MW | Everyone |
Sprint 10 Summary:
Main Achievements:
- Conducted the stress test and test of components, and completed soldering work.
- Handed in the paper overview and finalized the App and Paper.
- Held Retrospective 10; Chapter Project Management remains in progress.
Progress Check: ~88% of the planned work for this sprint is finished; Chapter Project Management is still in progress.
Effort Breakdown:
- Tasks Planned: 8
- Tasks Finished: 7
Sprint 11
This subchapter documents the outcome of sprint 11.
The following Table 25 shows the outcome of sprint 11.
| Sprint | Task | Duration | Responsible | Involved |
| 28/05/2026 - 03/06/2026 | ||||
| 11 | Chapter Project Management | 3 | IM | Everyone |
| 11 | UV-C Light | 5 | BA | Everyone |
| 11 | Review the Feedback on the paper | 10 | RP | Everyone |
| 11 | Daily meeting 29/05/2026 | 0.5 | GR | Everyone |
| 11 | Daily meeting 01/06/2026 | 0.6 | GR | Everyone |
| 11 | Daily meeting 02/06/2026 | 0.5 | MW | Everyone |
| 11 | Retrospective 11 | 1 | MW | Everyone |
| 11 | Simulation | 12 | GR | Everyone |
| 11 | Power supply adjustement | 4 | MS | Everyone |
| 11 | Polish up report | 10 | MW | Everyone |
| 11 | Fix typos in test report and plan | 3 | IM | Everyone |
Sprint 11 Summary:
Main Achievements:
- Ran the Simulation and completed the power supply adjustment and UV-C Light work.
- Reviewed paper feedback, polished the report, and fixed typos in the test report and plan.
- Held daily stand-ups and Retrospective 11; Chapter Project Management remains in progress.
Progress Check: ~91% of the planned work for this sprint is finished; Chapter Project Management is still in progress.
Effort Breakdown:
- Tasks Planned: 11
- Tasks Finished: 10
Sprint 12
This subchapter documents the outcome of sprint 12.
The following Table 26 shows the outcome of sprint 12.
| Sprint | Task | Duration | Responsible | Involved |
| 04/06/2026 - 10/06/2026 | ||||
| 12 | Chapter Project Management | 3 | IM | Everyone |
| 12 | UV-C Light | 5 | BA | Everyone |
| 12 | Final Presentation | 6 | MW | Everyone |
| 12 | Summary of report | 2 | MW | Everyone |
| 12 | Conclusion of each chapter | 5 | GR | Everyone |
| 12 | Work on comments of the report | 5 | RP | Everyone |
| 12 | Mount UV-c light assist testing | 5 | MS | Everyone |
| 12 | Retrospective | - | BA | Everyone |
Sprint 12 Summary:
Main Achievements:
- Prepared the Final Presentation, report summary, and per-chapter conclusions.
- Mounted the UV-C light for assisted testing and addressed report comments.
- Held the Retrospective; Chapter Project Management remains in progress.
Progress Check: ~88% of the planned work for this sprint is finished; Chapter Project Management is still in progress.
Effort Breakdown:
- Tasks Planned: 8
- Tasks Finished: 7
Scope Changes: TRAQ-220 (Retrospective) was added after sprint start.
Sprint Evaluations
This section evaluates the effectiveness of each sprint by reflecting on what went well and what could be improved. It includes insights into challenges faced, team performance, and lessons learned to optimize future sprints.
The teams' first retrospective in Figure 20 showed the teams' different education backgrounds and speed, the teams' general workload, and the main idea being lost. To fix this the team decided to book a 1-hour meeting where everyone spoke for 5 min and said where they think the project should head. This helped us find common ground. Other conclusions regarding speed and workload: the team decided to meet more often to spread the workload fairly through the team.


The teams' second retrospective (Figure 21) underlines less issues then the first sprint. The team also wrote what they will be improving inside the retrospective.


Retrospective 3 in Figure 22 mentions 3 main issues: sometimes it can be hard to define an equal amount of work for the team, some members being late, and lastly, some members still not being exactly familiar with the Scrum environment. The team decided to arrange a meeting where they would go over Scrum again and also to have longer sprint planning to properly define workload. General progress is still going good.


Retrospective 4 in Figure 23 was before the Easter break. The team now is getting ready for their interim report. No major issues faces the team will contact directly teachers regarding certain documents.


Retrospective 5 (Figure 24) took place after the interim report hand-in and presentation, with Max absent. The team agreed that the sprint went well overall: the interim report, the presentation, and all related deliverables were finished on time, and communication remained good throughout the Easter break despite the team not meeting in person due to the vacation. The main concern raised was workload distribution — the team relied heavily on Bernardo to finish tasks that were originally assigned to other members, and the conclusion was that every team member should take responsibility for completing their own tasks on time. No major blockers were identified, and the team felt ready going into the next sprint.

Retrospective 6 (Figure 25) was held after the interim presentation, with Maria absent. The team reported strong overall progress: the schematics were finalized, the mistakes identified during the interim presentation were addressed, and the report was fixed based on teacher feedback. Task distribution was praised, with the team noting they had even managed to get a head start on upcoming work. Two recurring issues were raised: slow response times from teachers on Teams and email — particularly regarding lab equipment access — which had blocked progress in previous sprints as well, and inconsistent task updates on Jira from some members, making it harder for the team to track who was working on what. As an improvement point, the team suggested starting to think concretely about the prototype design and build, and committed to keeping each other better updated on task progress.

Retrospective 7 in Figure 26 was held with Inès absent. The team reported continued strong progress: tasks were being completed on schedule, the teachers were happy with the project's direction, and components were being ordered. The sprint also covered planning for the physical assembly of the bottle and early ideas for product packaging. Several improvement points were raised: task distribution and coordination could still be better, communication around absences and progress updates needed to improve — with some members announcing absences too late or not updating the team on their work — and component links should be checked and verified before weekly meetings to avoid delays. The team also noted that since lessons are now less frequent, internal progress updates need to happen more regularly to compensate. The packaging strategy was identified as the next area to focus on.


Restrospective 8 in Figure was held with Inès absent. The team reported good overall progress: tasks were completed on schedule, the teachers were satisfied with the project’s direction, and most parts of the report had already been approved. Several improvement points were identified. Communication was weaker during the holiday break, and the team agreed that more regular progress updates are needed. Some inconsistencies in poster designs were also noted, highlighting the need for a more unified visual style. In addition, tasks and deliverables for the rest of the semester should be divided more clearly so everyone knows their responsibilities. Delays with STL files and issues with materials provided by the teachers were also mentioned as challenges during the sprint.


Retrospective 9 in Figure 28 was held with Maria absent. The team reported strong technical progress during the sprint: the prototype advanced significantly, the application was successfully connected to the hardware, most sensors were functioning, and the 3D design was completed and ready for printing. The team also received the project components and was finally able to begin working with the physical sensors. Teachers were satisfied with the project’s direction and overall progress. Several challenges were also identified. Some incorrect components were delivered, which affected the initial electrical system design, and the approaching prototype deadline created additional pressure on the team. Workload distribution was mentioned multiple times as an area for improvement, with some members experiencing a heavy workload depending on their technical background. The team also agreed that communication about weekly progress should improve further.

Retrospective 10 in Figure 29 highlighted strong overall progress, with the team completing the planned tasks for the week and advancing significantly on both the prototype and the project documentation. Most hardware components were connected to the application, extensive testing of individual components was carried out, and the paper and manual were nearly finished. The team also noted that, compared to other groups, a large number of tasks had already been completed, and the teachers remained satisfied with the project’s direction. Several improvement points were discussed. Communication between team members could still be improved, especially regarding updates on completed work and explaining individual tasks to the rest of the group. Delays in 3D printing and ongoing testing of the UV-C system slowed down the assembly of the prototype, which was not yet completed as originally planned. Workload distribution remained uneven due to different technical backgrounds and areas of expertise. As a result, the team agreed to focus strongly on completing and assembling the prototype during the next sprint.


Retrospective 11 in Figure 30 showed that the project was close to completion, with most tasks already finished and strong progress made on the prototype assembly. The team successfully mounted the bottle base, installed the hardware components, and documented component measurements and testing values in the project wiki. Teamwork remained positive, the planned tasks for the week were completed, and the teachers continued to be satisfied with the project’s progress. Some challenges were still identified. Testing of the UV-C light remained delayed due to safety concerns, limited equipment, and the lack of a suitable laboratory environment. The limited 12 V power supply also created constraints for battery usage during testing. Delays in final prototype validation highlighted the need for a clearer testing procedure for the UV-C system. Additionally, presentation skills and communication remained personal improvement points for some team members.

Summary
This chapter described how the TRAQUA project was planned, organised, and managed from start to finish. Using an agile Scrum framework with weekly sprints, the team structured its work around a Jira backlog, milestone-driven prioritisation, and regular ceremonies — planning, stand-ups, retrospectives, and demos — that kept progress aligned with the deliverable deadlines defined in the project plan.

The twelve sprints reveal a clear evolution in the team's process. Early sprints showed a recurring “late-crunch” pattern, where most work was completed in a short window near the end of each cycle, and commitment regularly exceeded the work actually delivered. As shown in the velocity chart (31), the gap between committed and completed story points was widest in the middle sprints but narrowed considerably toward the end of the project: in the final sprints the completed work closely matched the commitment, indicating that the team's estimation and planning matured over time. The team settled at an average velocity of roughly 29 story points per sprint.
The retrospectives were central to this improvement. Recurring issues — uneven workload distribution stemming from the team's mixed technical backgrounds, late absence notices, inconsistent Jira updates, and slow external feedback — were identified and acted upon, including a revised Definition of Done that restored burndown accuracy after Sprint 3. Risk management and procurement were handled proactively, with early ordering and backup suppliers limiting the impact of component delays.
Overall, the project was delivered on schedule and met its milestones, and the team finished with a markedly more predictable and disciplined process than it began with. With the product developed and the project successfully managed, the next chapter turns to the marketing plan, examining how TRAQUA could be positioned and brought to market.
Marketing Plan
Introduction
This chapter presents the marketing strategy for TRAQUA, based on insights derived from the market analysis. It outlines the key decisions required to successfully introduce the product to the market. The chapter includes the Business Model Canvas, SWOT analysis, strategic objectives, segmentation and targeting, positioning, and the marketing mix (4Ps). It also addresses branding, budgeting, and control mechanisms to ensure effective implementation and performance evaluation.
Business Idea Formulation
Before approaching potential customers or developing prototypes, it is important to clearly define and refine the value proposition of the proposed solution. The goal is to ensure that the concept addresses a real user problem while delivering a meaningful benefit. For the TRAQUA project, the business idea focuses on improving both the safety and the consistency of daily hydration. Many health-conscious individuals regularly use reusable water bottles however, they are often unaware that these containers can accumulate bacteria if they are not cleaned frequently [32]. At the same time, many people struggle to maintain a consistent hydration routine throughout the day. TRAQUA addresses these challenges by combining bottle sanitization technology with hydration monitoring in a single integrated system.
The proposed solution is a smart bottle equipped with an Integrated Smart Base that includes UV-C LEDs and TDS sensors. The UV-C technology automatically sterilizes the interior of the bottle, eliminating biological contaminants that may develop over time. Meanwhile, the sensors monitor water purity, ensuring that the stored water remains safe for consumption. By automating the sanitization process, the system removes the need for users to manually clean the bottle as frequently and provides additional confidence in the safety of the drinking environment.
In addition to improving hygiene, the TRAQUA Smart Bottle supports users in maintaining healthier hydration habits. The bottle connects to a mobile application that provides hydration tracking, reminders, and personalized feedback. Through gamified features and visual progress indicators, the application encourages users to meet their daily hydration goals and build more consistent habits. Although several smart bottles and simple hydration trackers are already available on the market, most of them focus primarily on measuring water intake. In contrast, TRAQUA differentiates itself by addressing both bottle hygiene and hydration behavior. By ensuring that the container remains sterile while also supporting user engagement through digital features, the solution offers a more comprehensive approach to safe and consistent hydration.
Business Model
To visualize and analyze how TRAQUA creates, delivers, and captures value, the team developed a comprehensive Business Model Canvas. This strategic tool illustrates the alignment between our technical innovation and the market’s demand for reliable hydration and hygiene solutions. Figure 32 shows the business model.

After presenting the Business Model Canvas, a detailed analysis is provided to explain how each component contributes to the overall functioning of the TRAQUA business model. This description is essential to demonstrate the logical connections between key elements such as value creation, customer segments, and revenue streams. By analyzing these components, the team highlights how TRAQUA effectively delivers value to its target users while ensuring economic viability. Furthermore, this breakdown allows for a clearer understanding of the strategic decisions behind the product, supporting the alignment between technological innovation, market needs, and sustainability considerations.
Key Partnerships
The project relies on a network of Key Partnerships to ensure both technical quality and market readiness. We collaborate with specialized hardware suppliers who provide the sensors and microchips required for our production line. Beyond the supply chain, Academic Mentors act as primary supervisors, offering the technical and strategic guidance needed to transition from a prototype to a viable product.
Universities also play a critical role in our development strategy as the main setting for the pilot stage. By providing the TRAQUA Smart Bottle to students, we can collect real-world data and user feedback. This phase allows us to evaluate system performance in a high-activity environment and refine the Hydration Coaching algorithms before a full-scale commercial launch.
Key Activities and Resources
The operational success of TRAQUA is driven by several Key Activities, including intensive research and development to optimize UV-C pathing and app development to ensure a seamless user experience. Part assembly and quality control are essential to our production process, ensuring each unit meets safety standards.
To support these activities, we rely on Key Resources such as specialized hardware (sensors, UV-C, and microcontrollers), prototyping tools and equipment, and knowledge related to our water-purity algorithms.
Value Creation and Delivery
The Value Propositions block highlights our differentiation through active sterilization and real-time water purity validation. Unlike passive containers, TRAQUA adds value by eliminating the need for manual cleaning and providing objective data on water quality. In addition, the Hydration Coaching feature encourages consistent hydration by reminding users to drink throughout the day.
This value is delivered to our primary customer segment active students, young adults, and health enthusiasts through an omnichannel strategy. This includes direct-to-consumer sales via our official website and partnerships with major e-commerce platforms such as Amazon. The product will also be available in premium retail stores targeting athletes and consumers who prioritize high-quality health technology and are willing to pay for verified performance.
Value Capture
TRAQUA captures value through a diversified revenue model. While primary sales of the physical bottle generate immediate income, a premium app version introduces a recurring revenue stream. This model is balanced against a cost structure focused on high-quality manufacturing, including production and assembly, as well as software and operational expenses related to maintaining our digital ecosystem.
Together, these elements ensure that the business remains sustainable as it scales from a university pilot to the broader consumer market.
Market Analysis
To gain a thorough understanding of market dynamics, customer needs, and the external factors influencing the success of the project, conducting a market analysis is essential. This process enables the team to view the market as a continuously evolving environment, ensuring that the TRAQUA bottle remains relevant and competitive.
Our analysis is divided into two main categories: macro-analysis and micro-analysis. Considering both perspectives improves the effectiveness of the organization’s marketing strategy and supports the long-term development of the brand. Continuous evaluation of these factors is also crucial to ensure that the organization is not negatively impacted by emerging internal or external forces [33].
Macro Analysis
Macro-analysis examines broader social forces — commonly referred to as PESTEL factors — that influence the entire business environment.
- Political/Legal – Government regulations and legal frameworks influence business operations. TRAQUA must comply with safety standards related to UV-C technology and data protection laws for its app ecosystem.
- Economic – Economic conditions, including income levels and consumer spending patterns, affect purchasing power. TRAQUA targets consumers willing to pay a premium for high-quality, durable health technology. However any changes in economic conditions and consumer spending patterns may reduce demand for premium-priced products.
- Social/Cultural – Social trends and cultural values shape consumer behavior. The growing focus on health, wellness, and sustainability creates a strong opportunity for a reusable, technology-enabled hydration solution [34].
- Technological – Advances in sensor technology enable TRAQUA to innovate by offering features such as Hydration Coaching and real-time water quality monitoring.
- Environmental – Environmental concerns relate to resource use and ecological impact. TRAQUA addresses the need to reduce single-use plastic waste by promoting a sustainable and reusable product [35].
Micro Analysis
Micro-analysis focuses on the forces close to the company that directly affect its ability to serve customers.
- Suppliers – Partners who provide the resources necessary to produce our product. These include hardware suppliers specializing in the production of sensors and microchips used to measure and support the bottle’s key features. Examples of such suppliers include companies like Mouser Electronics, Farnell, and Digi-Key, which offer a wide range of components required for prototyping and production.
- Customers – Individuals who purchase the product for personal use. Our primary segments include active students, young adults, and health enthusiasts who prioritize proper hydration and a healthy lifestyle.
- Competitors – A comparison of existing products is presented in Table 2 . Currently, no single product combines all of TRAQUA’s features, which creates an opportunity for competitive advantage.
- Resellers – Intermediaries who help promote, sell, and distribute TRAQUA products to final consumers. These may include online platforms and retail partners such as Amazon, specialized tech retailers, and premium lifestyle stores that focus on innovative and health-related products.
- Publics – Groups that have an interest in or impact on the organization: (i) Academic mentors, who provide technical and strategic guidance, supporting the transition from prototype to a market-ready product, (ii) Universities, which act as a key local public and serve as the primary environment for the pilot stage, and (iii) Influencers, particularly in the health, fitness, and lifestyle sectors, who can shape public perception and support brand awareness through digital communication.
SWOT Analysis
The SWOT analysis Figure 33 allows the team to evaluate the internal Strengths and Weaknesses of the TRAQUA project alongside the external Opportunities and Threats present in the dynamic health-tech environment.

Internal Factors
Strengths:
- Technological Innovation: The integration of UV-C sterilization with high-precision sensors provides a solution not currently available in the standard bottle market, giving Traqua a strong competitive advantage.
- Integrated Ecosystem: Features such as Hydration Coaching and gamification enhance the user experience and help build long-term customer loyalty.
- Strong Value Proposition: The combination of real-time water purity validation and active sterilization delivers clear functional value, differentiating Traqua from traditional reusable bottles.
Weaknesses:
- Price Sensitivity: The high cost of specialized sensors and microchips increases the final product price, which may discourage price-sensitive consumers compared to simpler, low-cost alternatives. Additionally, production costs may fluctuate due to external factors such as fuel prices, supply chain disruptions, and global economic conditions, which can further impact the final pricing strategy and profitability.
- Operational Complexity: Dependence on advanced hardware and ongoing software maintenance increases production complexity and places higher demands on quality control and technical support.
- Limited Brand Awareness: As a new product, TRAQUA may initially struggle to build trust and recognition in a competitive market dominated by established brands.
External Factors
Opportunities:
- Growing Health and Sustainability Trends: Increasing awareness of health, hydration, and environmental issues is driving demand for reusable and technology-enhanced products, particularly among younger consumers.
- Access to University Research and Collaboration: Using universities as testing environments enables efficient data collection, product refinement, and early adoption within a key target segment. This approach is also cost-effective, as it allows the team to conduct real-world testing and marketing activities at relatively low cost and risk. By leveraging existing academic networks and infrastructure, TRAQUA can validate its product and business model before committing to large-scale market entry
- Expansion of Smart Technology Market: The rising popularity of smart devices creates opportunities for TRAQUA to position itself within the broader health-tech ecosystem.
Threats:
- Rapid Technological Change: Fast-paced advancements in technology require continuous updates to both hardware and software. Failure to keep up may result in product obsolescence.
- Economic Uncertainty: Changes in economic conditions and consumer spending patterns may reduce demand for premium-priced products.
- Increasing Competition: Established brands or new entrants may introduce similar features at lower prices, reducing TRAQUA's competitive advantage over time.
Strategy
An effective marketing strategy is essential for connecting a company’s product with its target audience and ensuring long-term success. It involves understanding customer needs, analyzing market conditions, and developing coordinated actions that allow a business to achieve its objectives. Marketing strategies are not static, they must continuously adapt to changing market trends, consumer behaviour, and technological developments [36].
Strategic Objectives
The primary strategic objective of TRAQUA is to successfully introduce a smart hydration solution to the market and establish a clear competitive position within the health-tech industry. To achieve this, the project defines key goals across three critical pillars: economic, customer-oriented, and product-oriented.
Economic objectives focus on ensuring financial sustainability and long-term profitability:
- Revenue Generation - achieve steady revenue growth through the sale of the TRAQUA smart bottle and the introduction of a premium app subscription model.
- Cost Management - maintain cost efficiency in production and operations while ensuring high product quality.
- Profitability - reach break-even point within the early stages of market entry (after the pilot phase) and gradually increase profit margins.
Customer-oriented objectives focus on attracting, satisfying, and retaining users:
- Customer Acquisition - gain early adopters within the student and young adult segments through pilot programs and targeted marketing campaigns.
- Customer Satisfaction - deliver a high-quality product and user experience that meets expectations in terms of functionality, reliability, and ease of use.
- Customer Retention - build long-term relationships through app engagement, personalized hydration coaching, and continuous product improvements.
- Brand Awareness - increase brand recognition among target segments through consistent promotion and digital presence.
Product-oriented objectives relate to innovation, quality, and continuous improvement:
- Product Development - continuously enhance the smart bottle and mobile application based on user feedback and technological advancements.
- Innovation Leadership - maintain a competitive edge by improving features such as UV-C sterilization, sensor accuracy, and data analytics.
- Quality Assurance -ensure high standards of safety, durability, and performance through rigorous testing and quality control processes.
- User Experience Optimization - improve usability, design, and functionality to create a seamless and intuitive product experience.
Segmentation and Targeting
To effectively reach its audience, TRAQUA applies a segmentation strategy based on demographic, behavioural, and psychographic factors. This approach allows the company to better understand customer needs and tailor its offering accordingly [37].
- Demographic Segmentation: TRAQUA primarily targets young adults, particularly students and early-career individuals, who are more open to adopting new technologies and lifestyle-oriented products.
- Behavioural Segmentation: The product is aimed at consumers who actively monitor their health, use fitness or smart applications, and are interested in improving their daily habits, including hydration.
- Psychographic Segmentation: TRAQUA focuses on individuals who are health-conscious, environmentally aware, and value innovation, convenience, and modern design [38].
Based on this segmentation, TRAQUA adopts a focused targeting strategy, concentrating on:
- Active students
- Young adults
- Health enthusiasts
- Eco-Conscious Professionals
These consumers are more likely to invest in products that enhance their well-being and support a sustainable lifestyle.
Marketing Persona
To better represent the target audience, a marketing persona has been developed:
- Name: Max
- Age: 23
- Occupation: University student
- Lifestyle: Active and busy, regularly attending classes, working part-time, and engaging in fitness or outdoor activities
- Behaviours: Uses mobile applications to track health and productivity, values convenience, and is open to adopting new technologies
- Needs: A reliable and easy way to maintain proper hydration, ensure water safety, and reduce the effort associated with bottle cleaning
- Values: Health, sustainability, efficiency, and modern design
This persona in Figure 34 illustrates the typical TRAQUA user and helps guide product development, communication strategies, and marketing decisions.

Positioning
Positioning defines how TRAQUA is perceived in the minds of consumers relative to competing products. The objective is to establish a clear, distinctive, and desirable place in the market by emphasizing the product’s unique combination of features and benefits [39].
TRAQUA is positioned as a premium, high-technology smart bottle. Unlike traditional reusable bottles and basic smart bottles, TRAQUA offers a comprehensive solution by combining UV-C sterilisation, real-time water purity monitoring, and personalised hydration coaching within a single ecosystem. This positioning allows TRAQUA to differentiate itself from competitors by delivering a broader and more advanced set of features. While many existing products focus on only one function—such as hydration tracking or sterilization—Traqua integrates multiple capabilities, creating a more complete and intelligent user experience.
The perceptual map in Figure 35 is based on the products analyzed in Table 2, ensuring consistency between the comparative analysis and the visual positioning of competitors. The map visually represents TRAQUA’s position in relation to key competitors based on two dimensions: price and level of technology. On the horizontal axis, products are arranged from low to high technological complexity, while the vertical axis represents price from low to high. Traditional reusable bottles, such as Equa Smart and Ozmo Active, are positioned in the lower-left quadrant, reflecting their relatively low price and limited technological features. Mid-range smart bottles, such as HidrateSpark, offer more functionality but remain moderate in both price and technology. Premium competitors like LARQ and Aqua Vault are located in the upper-right area of the map, indicating higher prices and more advanced features, particularly in sterilization technology. However, TRAQUA is positioned further along the technology axis and slightly below the highest-priced competitor, highlighting its more advanced and integrated functionality while maintaining a relatively more accessible price point.
This positioning reinforces TRAQUA’s strategy of differentiation through innovation rather than price competition. By offering a unique combination of features within a single product, TRAQUA targets consumers who prioritise quality, performance, and long-term value. The perceptual map clearly illustrates that TRAQUA occupies a distinct position in the market, delivering the highest level of technological integration while remaining competitively priced within the premium segment.

Marketing-Mix
The marketing mix is a fundamental framework used to implement marketing strategy by combining key controllable elements that influence consumer response. It consists of four main components - Product, Price, Place, and Promotion - which must be carefully coordinated to meet customer needs and achieve organizational objectives [40]. For TRAQUA, the marketing mix is designed to support its positioning as a premium, technology-driven hydration solution and to create a strong competitive advantage in the market.
Product
The core product is the TRAQUA smart bottle, which integrates advanced features such as UV-C sterilization, real-time water purity monitoring, and a connected mobile application offering hydration tracking and coaching. The product strategy focuses on:
- Advanced technological functionality
- User-friendly interface and seamless app integration
- Sustainability through reusability and reduced plastic waste
In addition to the physical product, the digital ecosystem (mobile app and premium features) enhances the overall value proposition, transforming TRAQUA from a simple bottle into a comprehensive health-support tool.
Price
TRAQUA adopts a premium pricing strategy, reflecting its advanced technology, innovation, and added value compared to traditional bottles. Taking into consideration mass production, the estimated cost of one bottle will be around 160 - 220 €. The pricing strategy is based on:
- Value-based pricing – aligning price with perceived benefits (health, safety, convenience)
- Competitive positioning – remaining within the premium segment while still being more accessible than the most advanced competitors
- Revenue diversification – combining product sales with steady revenue from a premium app subscription
This approach reinforces the brand’s high-quality image while ensuring long-term financial sustainability.
Place
The distribution strategy focuses on making the product easily accessible while maintaining its premium positioning. TRAQUA will be distributed through:
- Direct-to-consumer channels (official website)
- E-commerce platforms (e.g., Amazon)
- Selective retail outlets, particularly premium and sports-oriented stores
Additionally, the university pilot program plays a key role in early distribution, allowing the product to reach its primary target audience and generate initial market traction. This multi-channel approach ensures both availability and brand control.
Promotion
The promotion strategy is designed to increase brand awareness, inform potential customers, and clearly communicate the product’s unique value.
Key promotional activities include:
- Collaborations with influencers in the fitness, health, and lifestyle sectors
- Social media marketing targeting students and young adults
- University-based campaigns during the pilot phase
- Digital advertising and content marketing highlighting health, innovation, and sustainability
The communication strategy emphasizes:
- The benefits of clean and safe water
- The convenience of smart hydration tracking
- The environmental impact of reusable solutions
This integrated promotional approach ensures consistent messaging and strong engagement with the target audience.
Brand
The TRAQUA brand is designed to clearly communicate the product’s core value: combining advanced technology with everyday hydration. Both the name and visual identity play a key role in reinforcing this positioning and creating a strong connection with the target audience.
Brand Name and Logo
The name TRAQUA is a strategic combination of the words “Track” and “Aqua,” reflecting the brand’s dual focus on technology and water.
- Track represents the monitoring aspect of the product, including hydration habits, user goals, and real-time water quality analysis. It highlights the dynamic and continuous interaction between the user and the product through data and feedback.
- Aqua emphasizes the core function of the product - water. It reinforces the brand’s focus on purity, safety, and hydration, as well as the key feature of active sterilization.
Together, the name communicates a clear and memorable message: a smart solution that combines hydration with intelligent tracking. The logo can be seen in Figure 36.

Flyer
The TRAQUA flyer Figure 37 is a strategic visual element designed to communicate the brand’s identity and highlight the product’s technological capabilities through a clear and intuitive layout. It helps translate complex technical features into a user-friendly message, making the product more accessible to potential customers.
The slogan, “Know your water. Trust your bottle.”, serves as the central message of the flyer. It reflects the brand’s mission by combining two key aspects: data-driven insight through water quality monitoring and a sense of safety ensured by sterilization. This reinforces TRAQUA's focus on reliability and user trust.
The flyer also uses a callout system to present the main product features. Elements such as the integrated UV-C base for self-cleaning and the mineral tracking system for real-time validation are clearly highlighted, helping users understand how the technology is embedded in the product.
In addition, the inclusion of App Store and Google Play icons, along with Bluetooth connectivity, emphasizes the digital ecosystem surrounding the product. This communicates that TRAQUA is not only a physical product but also a connected solution supported by a mobile application. Finally, the presence of institutional logos such as ISEP and P.PORTO strengthens the credibility of the project, indicating its academic background and connection to research and technical expertise.
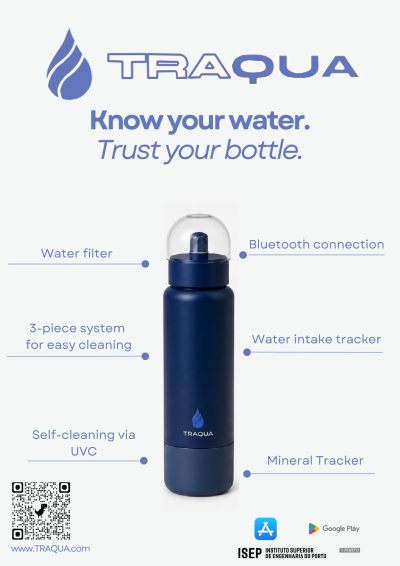
Marketing Programmmes
Programmes
1. University Pilot Programme
The university pilot programme serves as the initial market entry strategy. TRAQUA bottles will be introduced within selected universities, allowing students to test the product in a real-life environment. This programme aims to:
- Generate early adoption among the target audience
- Collect user feedback for product improvement
- Build brand awareness through direct experience
This approach reduces risk while validating both the product and the business model.
2. Social Media Campaigns
Social media platforms will be a primary communication channel, especially for reaching younger audiences. Campaigns will focus on visually engaging and informative content. Key actions include:
- Posting content related to hydration, health, and daily habits
- Demonstrating product features and benefits
- Sharing user experiences and opinions
- Running targeted advertisements to increase reach
The goal is to create engagement, build a community, and strengthen brand visibility.
3. Product Launch Campaign
A coordinated product launch campaign will be implemented to introduce TRAQUA to the wider market after the pilot phase. Key elements include:
- Launch events or online announcements
- Limited-time offers
- Promotional bundles (e.g. bottle + premium app trial)
This programme aims to create initial demand and accelerate market penetration.
4. Influencer Marketing Programme
TRAQUA will collaborate with influencers in the fitness, health, and lifestyle sectors to promote the product. This programme includes:
- Product reviews and demonstrations
- Integration into daily routines (e.g. gym, study, travel)
- Authentic content that highlights real-life usage
Influencers help build credibility and trust, especially among younger consumers.
Budget
As part of its growth strategy, TRAQUA plans to expand its promotional activities across multiple European markets. The marketing approach will be localized, meaning that campaigns will be adapted to each country’s culture, language, and consumer preferences. A key element of this strategy is the selection of country-specific influencers and public figures, particularly those connected to fitness, health, and lifestyle. By collaborating with well-known local personalities, TRAQUA can increase credibility, relevance, and audience engagement in each market.
In the German market, personalities such as Pamela Reif — a leading fitness influencer [41] and Joshua Kimmich, a professional football player [42] are strategically selected due to their strong association with health, performance, and discipline, which closely aligns with TRAQUA’s value proposition. Collaborations with such high-profile figures require significant investment. Industry benchmarks indicate that macro-influencers with millions of followers may charge between 50 000 € and 200 000 € per campaign, while professional athletes often command even higher endorsement fees depending on the scope and duration of the partnership [43]. Therefore, the proposed budget reflects a premium market entry strategy, where a substantial portion of resources is allocated to influencer and athlete partnerships to maximize brand awareness, trust, and market impact. To illustrate this approach, a sample budget is presented for the German market, one of the largest and most health-conscious markets in Europe, is presented in Table 27.
| Item | Cost (€) | Explanation |
| Social Media Advertising | 10 000 | Budget allocated for large-scale targeted campaigns on Instagram, TikTok, and Google. Supports high reach and complements influencer exposure. |
| Influencer Collaboration (Pamela Reif) | 80 000 | Estimated cost for collaboration with a top-tier fitness influencer. High reach and strong engagement among health-conscious consumers justify the investment. |
| Athlete Partnership (Joshua Kimmich) | 120 000 | Estimated endorsement cost for a professional athlete. Builds credibility, trust, and premium brand perception. |
| Launch Campaign | 10 000 | Includes coordinated product launch, promotional offers, and digital campaigns to maximize initial market impact. |
| Content Creation | 5 000 | High-quality video production and promotional materials aligned with premium brand positioning. |
| Total | 225 000 | Total estimated budget for premium entry into the German market. |
Control
To ensure that TRAQUA’s marketing strategy is effectively implemented and continuously improved, we decided to apply the PDCA (Plan-Do-Check-Act) cycle. This approach provides a structured method for monitoring performance, evaluating results, and making necessary adjustments.
Plan
In the planning phase, TRAQUA defines its marketing objectives, strategies, and key performance indicators (KPIs). These include targets related to sales, customer acquisition, brand awareness, and user engagement.
Key targets include:
- Achieving 1000 – 2000 units sold within the first year
- Reaching 500 – 1000 users during the university pilot phase
- Growing to 3000 + users after market launch
- Building 5000 – 10000 social media followers
- Maintaining 60 – 70 % customer retention rate
- Ensuring 40 – 50 % weekly active app users
Clear benchmarks are established to measure success, such as expected growth in users, revenue generation, and app activity levels.
Do
In this phase, the planned marketing activities are implemented. This includes executing marketing programmes such as:
- University pilot campaigns
- Social media and digital marketing
- Influencer partnerships
- Product launch initiatives
The goal is to deliver the strategy as designed and reach the defined target audience effectively.
Check
This phase focuses on monitoring and evaluating performance by comparing actual results with planned objectives. Key performance indicators include:
- Sales volume and revenue (target: 1000 – 2000 units/year)
- Customer acquisition rate (target: steady monthly growth)
- Customer retention rate (target: 60– 70 %)
- Social media engagement (likes, shares, follower growth)
- Website traffic and conversion rates
- App usage metrics (target: 40 – 50 % weekly active users)
Data is collected and analyzed regularly to assess the effectiveness of marketing activities and identify any gaps or issues.
Act
Based on the evaluation, corrective actions are taken to improve performance. This actions may involve:
- Adjusting marketing campaigns or communication strategies
- Refining pricing or promotional offers
- Improving product features based on customer feedback
- Modifying targeting or distribution channels
This phase ensures that the strategy remains flexible and responsive to market changes.
By applying the PDCA cycle, TRAQUA ensures a process of continuous improvement. This allows the company to adapt to evolving customer needs, technological developments, and competitive pressures, ultimately supporting long-term success.
Summary
The market analysis provided a comprehensive understanding of both the micro- and macro-environment in which company will operate. It highlighted key trends such as increasing health awareness, the growing demand for sustainable products, and rapid technological advancements in the smart consumer goods sector.
Based on this market and economic analysis, the team decided to develop a smart hydration bottle with integrated UV-C sterilization and real-time water quality monitoring, targeted at health-conscious consumers, active students and young adults. This decision is supported by the rising demand for innovative, sustainable, and health-focused solutions, as well as a clear gap in the market for a product that combines hygiene, hydration tracking, and smart features. Consequently, the proposed solution incorporates key features driven by market needs, including active sterilization, real-time purity validation, hydration coaching, and mobile application integration. These elements respond directly to consumer expectations for convenience, safety, and sustainability, while also providing a strong competitive advantage.
The findings of this chapter not only justify the strategic direction of the product but also highlight the growing importance of sustainability as a key decision factor for consumers. Therefore, the following chapter focuses on eco-efficiency measures, examining how TRAQUA can minimize its environmental impact while maintaining high performance and long-term value.